scow
front

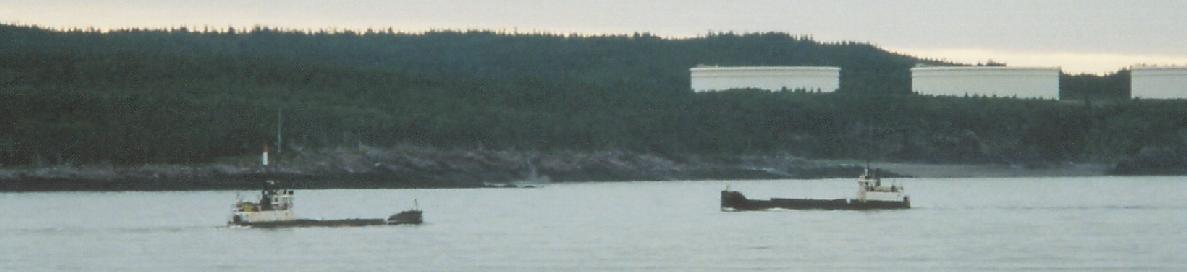
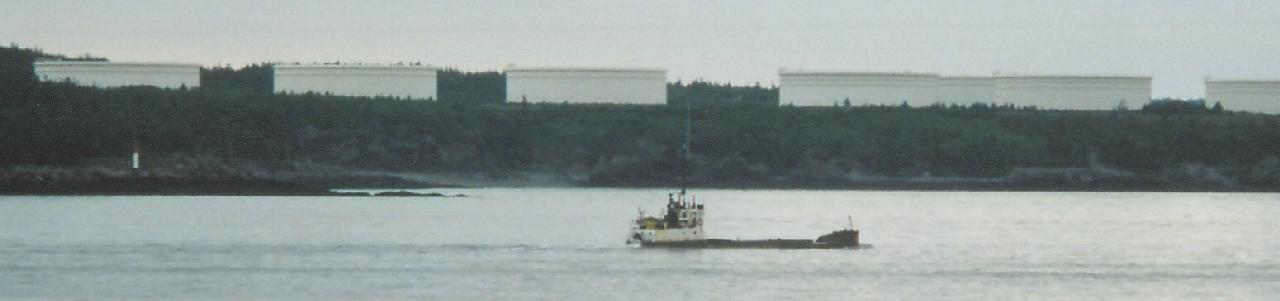
Dredge Scow Plumes and Tidal Fronts
Blacks Point Offshore Disposal Site
- Saint John Harbour Approaches

Acoustic and Optical Backscatter Imaging
C.S.L. Heron - October 22nd 2003


John E.Hughes Clarke
Ocean Mapping Group
Dept. Geodesy and Geomatics Engineering
University of New Brunswick
Russell Parrot
Geological Survey of Canada - Atlantic
Bedford Institute of Oceanography
Natural Resources Canada


Contents


Introduction

Natural Resources Canada (NRCan), in partnership with Environment Canada (EnvCan)  and the Ocean Mapping Group (OMG) at UNB all have had a long term interest in the oceanographic and sedimentary environment seaward of Saint John harbour. NRCan and EnvCan have focussed primarily on the fate of the dredge spoil deposited at the Blacks Point site. NRCan also has a regional geological framework interest in the Quaternary sedimentary history of the Fundy basin. As an extension of this program, the OMG has been focussing on a banner bank sandwave field to the east of the disposal site.

The major focus for all groups has been on the introduction, transport and fate of sand and silt sized material in the complex oceanographic environment seaward of Saint John.  The  various studies have involved physical sampling of the sediments (camera, video drift, gravity cores  and box-cores), current field observations (bottom-mounted and hull-mounted ADCP's, S4's) and numerical modelling.

For all  concerned, one of the hardest components to tie down is the the fate of the suspended sedmients. This traditionally involved watersampling to estimate gm/litre. This specific project was an attempt to try and use acoustic volume scattering and/or optical backscatter as a viable substitute for physical sampling. If successful this would allow a far greater spatial and temporal density in sampling. This woulds allow us to examine the distribution and fate of these sediments over a complete tidal cycle.


 Instrumentation and Methods


The Ocean Mapping Group has already invested significant research and software development into the use of acoustic backscatter as an aid in imaging water mass boundaries in the Saint John River estuary.  Three tools were seen of particular potential in the delination of suspended sediments:


Experimental Plan

region
 For a period of 4 days in October 2003, CSL Heron  waited  downstream of the Reversing Falls for an opportunity to try out this sensor combination  whilst active dumping was taking place on the Blacks Point Dump Site.   Whilst the 200 and 600 kHz acoustic backscatter had been used before offshore (and the MVP also, although not for oceanographic purposes), the optical backscatter probe had only recently been installed with the first results obtained a few days earlier in the Long Reach section of the Saint John River estuary (see web page).

On only one of these days (JD 295, October 22nd), the seastate was low enough to  operate (< seastate 2) and the following experiments were conducted:


Background water mass distribution


prefront
  Whilst waiting for the first dredge scow to come out. Two cross sections were run to test out procedures and to provide a background context for likely water masses in the area a few hours after the last scow.

To the left one can see the navigation tracks. All data is presented, projected laterally onto the long axis of the rectangle plotted over the navigation. Data is shown herein plotted steaming from WSW to ENE.

To the right one can see all the profiles of optical backscatter (raw millivolts units). This allows one to see the trends of the data and  the typical range of the data during this specific experiment. What is of course most apparent is that the data were clipping at ~ 4600mV unfortunately.

A clear boundary in optical backscatter is seen at depths ranging from 15 to 25m.
10


Pass 1
(line 0, 1411 GMT)
prefront
prefront
  • 200 kHz backcatter (light is strong)
  • 600 kHz backscatter (light is strong)
  • MVP- optical backscatter (greyscale, 1000-5000mV)
All plots range from 0-20m depth
All subsequent plots use the identical scaling parameters as listed above.
  • ADCP current azimuth and velocity
    (red-left, green-right, blue-into_page, yellow-outof_page)
  • MVP - Temperature 11.5-12.0 degC
  • MVP - Salinity 30.5-32.5 ppt

In this first pass we see a clear boundary in the 600 kHz backscatter suggesting a plume descending to the west of the dumpsite apex. This plume is not directly correlated with the temperature or salinity, but appears to match the higher optical backscatter readings.


Pass 2
(line 1, 1420 GMT)
prefront
prefront

is this case we see that the high optical backscatter signature extends both east and west of the dumpsite apex.


Tidal Front Red Herring

full front
tidal front/ river plume limit extending from dumpsite buoy to GOMOOS buoy, (August 2003)


prefront
At 1600 GMT finally a scow was sighted and 8 runs were conducted. Initally we planned to steam orthogonal to the scow track and look at the dispersion of the plume to the WSW. For the first pass we were slightly inshore of the plume but picked up an interesting target at almost the same time.  Based on the 200 and 600kHz real-time imaging, we lengthened or shortened or repositioned the line to try and profile along, what appeared to be, the centre and extent of the immediate dump plume.

As it turned out however, we'd missed the main plume and were actually tracking the high acoustic backscatter signature associated with the front of the ebb-tide Saint John river-water plume.

To the left one can see the navigation tracks. All data is presented, projected laterally onto the long axis of the rectangle plotted over the navigation. Data is shown herein plotted steaming from WSW to ENE

To the right one can see all the profiles of optical backscatter (raw millivolts units). This allows one to see the trends of the data and the typical range of the data during this speicfic experiment. What is of course again most apparent is that the data were clipping at ~ 4600mV unfortunately.

front

Pass 1
(line 2, 1615 GMT)
front
front
First pass behind the scow. We see significantly elevated optical backscatter in the deepr water to the west. What is not immediately apparent is that to the east is an intruding surface watermass, that is - clearer opticall,, lower backscatter at 600 kHz, cooler and fresher and moving at a discrete  current azimuth. This is of course the front, although we didn't realise it at the time.

Pass 2
(line 3, 1619 GMT)
front
front
On the second pass, a clear high acoustic backscatter target is noted which is actually the tip of the front. We'd actually missed the dredge spoil plume completely.

Pass 3
(line 4, 1623 GMT)
front
front
Same story, the plume is moving on the surface to the west (deep currents actually moving into the bay, surface current moving to the WSW). The plume has a clear lower T and S signature and is made up of clearer water than the higher optical backscatter layer below.  

Pass 4
(line 5, 1628 GMT)
front
front
Shorter line but still shows the tip of the plume.

Pass 5
(line 6, 1632 GMT)
front
front
Interestingly the high optical backscatter in the lower layer dies way to the west. THe surface plume has all the same discrete characterisitics. Even a suggestion of internal waves on the interface visible in the 600 kHz backscatter.

Pass 6
(line 7, 1641 GMT)
front
front
Front migrating further to the west. Tip seen well in 200 kHz. 600 kHz nicely defines the deepr interface. A clear colder and fresher signtaure on the CTD. Note the shear in the ADCP data.

Pass 7
(line 8, 1653 GMT)
front
front
Slight complication as GPS goes walkabout (sunspot events). But we see the front has now hit a secondary front moving in from the west. This new front has a much colder, much fresher surface signature.

Pass 8
(line 9, 1703 GM T)
front
front
last line, new fresher front from the west that has collided is actually pushing the boundary back to the east.

front viewed towards canaport
view looking to the SE, past the GOMOOS buoy to a tanker moored at the Canaport Buoy.
Note the presence of a tidal front visible as a rough surface extending across the centre of the image
(August 2003)


1st Dredge Scow Plume

two scows
two dredge scows arriving (left) and departing (right) the dumpsite apex
 (note extreme change in freeboard after release), August 2003

A
At 1700 GMT a second scow was sighted and 8 runs were prepared where we ran in directly behind the scow in its wake for the first pass. Based on the 200 and 600kHz real-time imaging, we lengthened or shortened or repositioned the line to try and profile along, what appeared to be, the centre and extent of the immediate dump plume.

To the left one can see the navigation tracks. All data is presented, projected laterally onto the long axis of the rectangle plotted over the navigation. Data is shown herein plotted steaming from inshore to offshore.

To the right one can see all the profiles of optical backsactter (raw millivolts units). This allows one to see the trends of the data and the typical range of the data during this specific experiment. The low optical scatter in the upper water mass is now significantly higher and again the data were clipping at ~ 4600mV unfortunately. Interestingly though the lower layer of high optical backscatter see under the prior tidal front is largely absent for these runs.

10

Pass 1
(line 10, 1716 GMT)

dredgeA
The closest we ever got to the scow, we appeared to have captured the falling coarse sediment. We didn't get the MVP in it though (spaced on either side unfortunately).

Pass 2
(line 11, 1721 GMT)

11
On the way back through we see the deep plume but also two surface plumes (perhaps as we steamed through the 180 deg. turn of the scow). Optical backscatter results are rather moderate though (again undersampling).

Pass 3
(line 12, 1724 GMT)
12
12
We appear to have captured the plume with one of these dips.  The surface-attached plume is very visible in the acoustic backscatter at both frequencies.

Pass 4
(line 13, 1729 GMT)
13
13
Plume captured again optically, the acoustic signature is slowly diffusing. Fro the first time we are starting to notice the oblique streaks of high 200 kHz backscatter over the crest of the dump. Our current hypothesis is that these are wave resuspension events?

Pass 5
(line 14, 1733 GMT)
14
14
here we see a surface optically-clear water-body seaward of the dump crest. It looks like a cooler fresher surface plume (with higher optical backscater presumably a result of the recent discharge) is migrating seaward out on top of that clearer watermass.

Pass 6
(line 15, 1738 GMT)
15
15
THe plume is overriding the clearer watermass. Wave resupension? events very clear over dump crest.

Pass 7
(line 16, 1745 GMT)
16
16
A second plume? even cooler and fresher is migrating seaward behind the first.  Not clear if any of the higher optical backscatter signature has anything to do with the dumping or whetherit is a characteristic of the river plume.

Pass 8
(line 17, 1751 GMT)
17
17

Extensive wave resupsension going on ove rthe crest of the dune.  No real evidence that the recent dumping is influencing this picture.


2nd Dredge Scow Plume

And approximately 25 minutes later a second scow came out...

scow point
solitary dredge scow passing Blacks Point beacon, Canaport Oil storage in background (August 2003).

B
At 1800 GMT a third scow was sighted and 5 more runs were carried out again where we ran in directly behind the scow for the first pass. As before, based on the 200 and 600kHz real-time imaging, we lengthened or shortened or repositioned the line to try and profile along, what appeared to be, the centre and extent of the immediate dump plume.

To the left one can see the navigation tracks. All data is presented, projected laterally onto the long axis of the rectangle plotted over the navigation. Data is shown herein plotted steaming from inshore to offshore.

To the right one can see all the profiles of optical backscatter (raw millivolts units). This allows one to see the trends of the data, the typical range of the data during this specific experiment. What is again, of course most apparent is that the data were clipping at ~ 4600mV unfortunately.

20

 
Pass 1
(line 19, 1812 GMT)
b
b
One can see the plume descending from the scow. Also one can see the oblique banding of the apparent wave-induced resuspension over the crest of the dump site.
 The plume is not yet well picked up by the optical probe. The wave resuspension does show up slightly in the optical signature close to the bottom. Interestingly, the onset of the dredge plume has a notably colder and fresher signature (the water temperature in the dock in the harbour perhaps?).

Pass 2
  (line 20, 1816 GMT)
b
b
We can now see the descending plume in all three (200-600 and optical).


Pass 3
(line 21, 1821 GMT)
b
b
As we start to extend the line over the crest of the dump we see a body of deeper clear water lying seaward of the crest, not tainted by the wave resuspension.

Pass 4
(line 22, 1826 GMT)
b
b
What little remains of the suspended part of the plume appears to have migrated over the top of the crest. Currents (green) indicate flow seaward0.

Pass 5
(line 23, 1833 GMT)
b
b
In this last image, the plume has gone but the wave resuspension is very evident. The deeper clear water may have penetrated over the top of the dump crest (although this may also be extrapolation of too sparse MVP dips too.). The currents switch to red at depth indicating an inward flow (or am I more colour blind than I thought!). The deeper clearer water is actually warmer and saltier than the surface watermass.


As the seastate was picking up and it was late in the day, the experiment was terminated at this point.


Summary and Conclusions


The main conclusions found from this brief test were:


Recommendations and Future Plans.

The optical backscatter probe is now a permanent part of the UNB MVP-30 sensor package. It will be deployed at all times for all hydrographic, oceanographic and sediment transport experiments in 2004.

Recommendations include:

Current plans for 2004  with the MVP include:


last updated by John E. Hughes Clarke , March  2004