CCGS Amundsen EM300
Deep Water Trials - 2500m contour, Labrador Sea
October 3rd-4th 2004
John E. Hughes Clarke and Kristian Llewellyn
Ocean Mapping Group
University of New Brunswick

Executive Summary

coverage capabilityBetween the 2nd and 7th of October 2004, CCGS Amundsen steamed in transit from Ungava Bay to Quebec City, via the Labrador Sea.  The vessel was deliberately diverted to an offshore route, roughly along the 2500m contour in order assess the bottom tracking capability of the hull-mounted Simrad EM300 30 kHz multibeam sonar. During the period in 
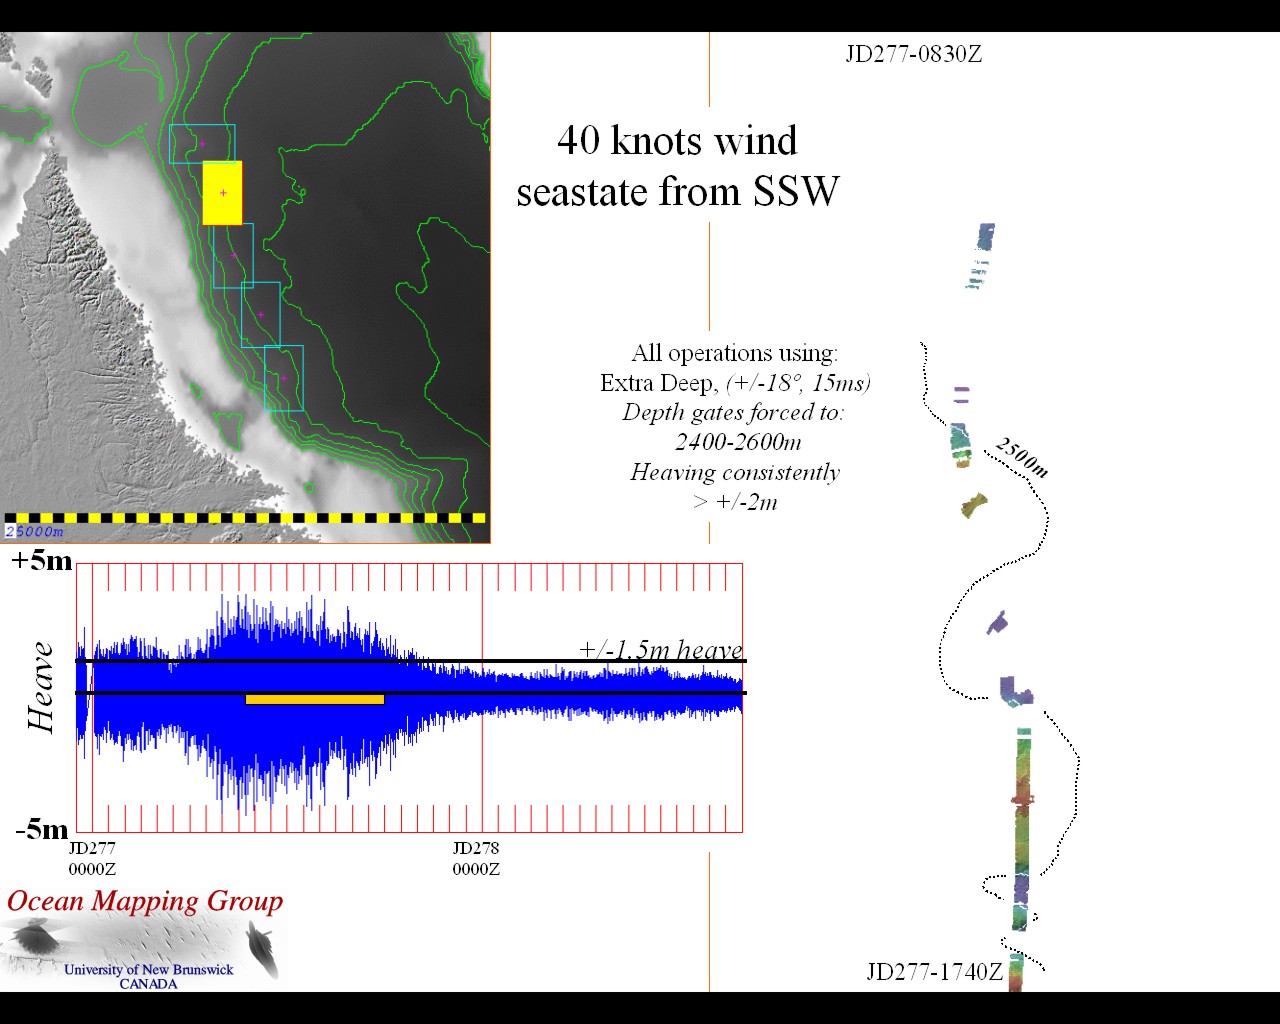
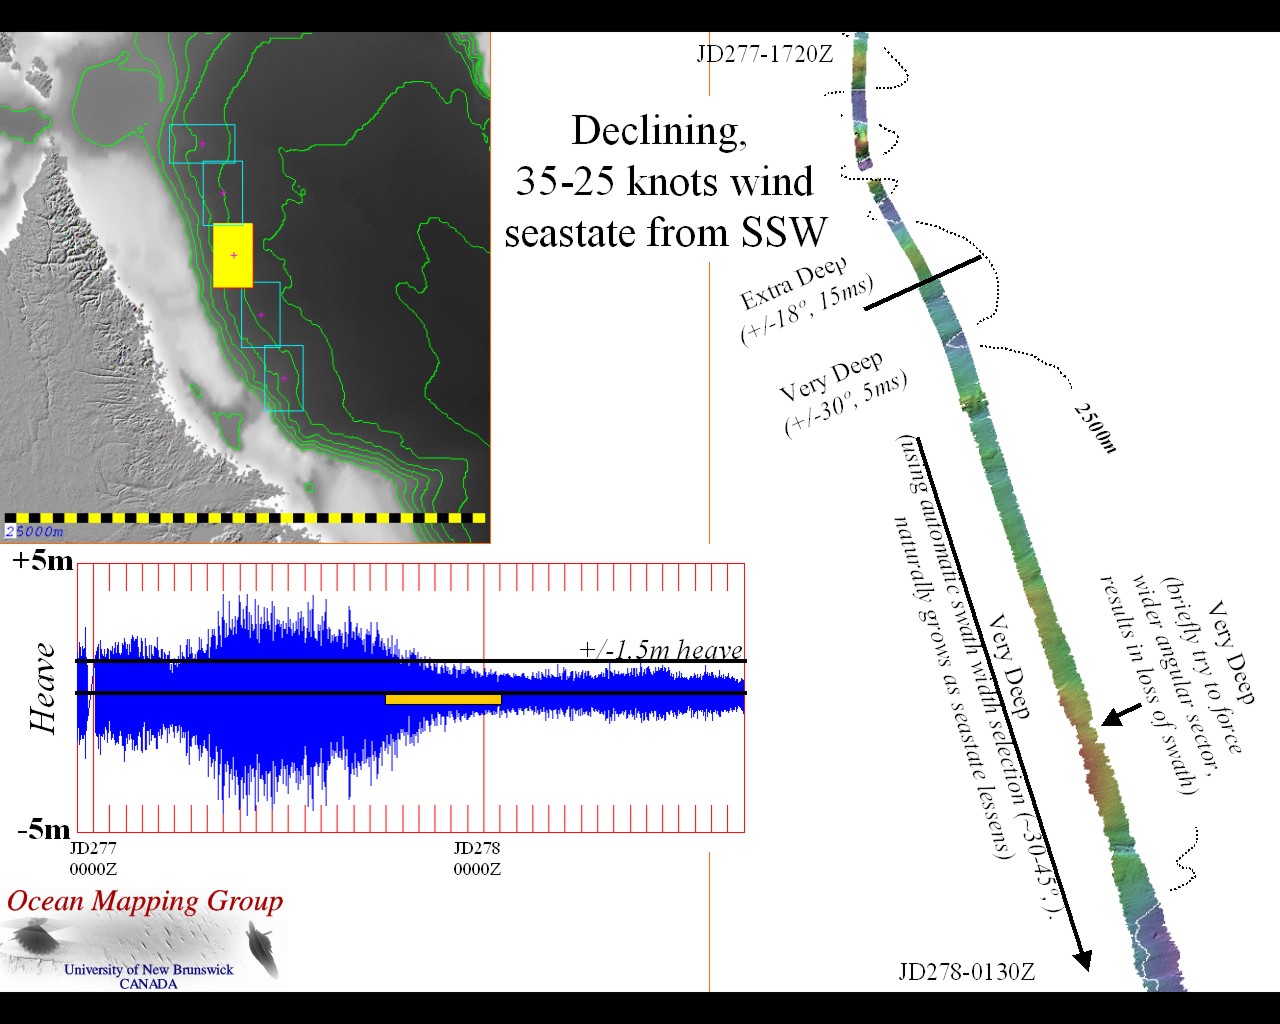
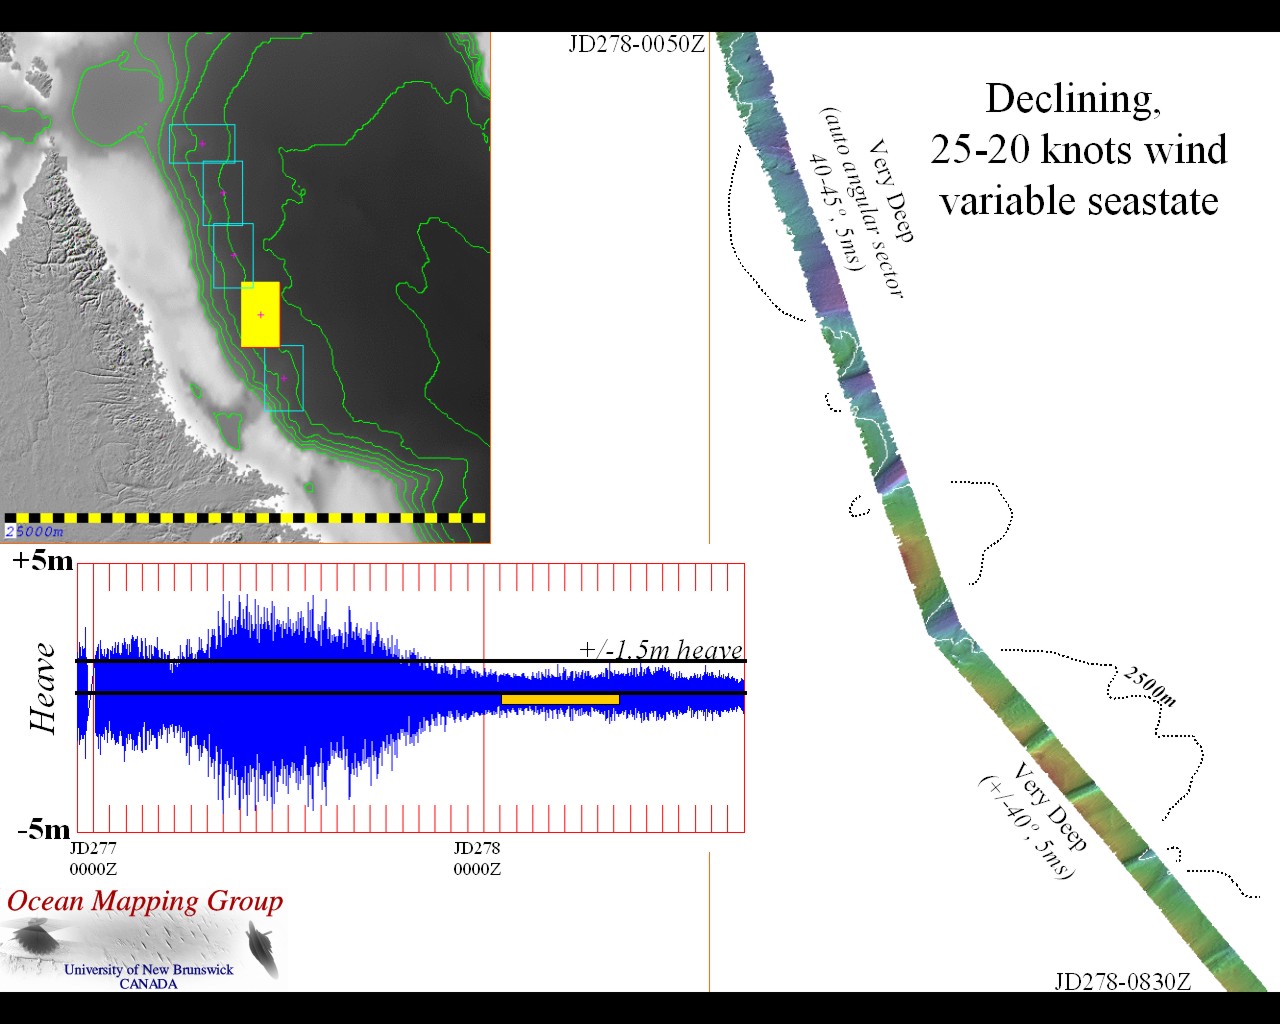
deep water, the vessel steamed through a 40 knot gale but the more southerly section took place with winds as light as 15 knots.
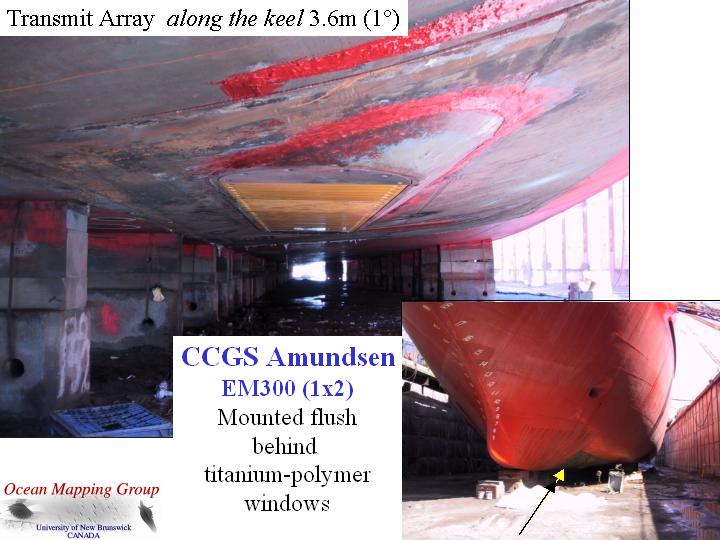
The results, illustrated in the summary figure to the right, indicate that the sonar system provides excellent data in seastates up to ~5  (~< 20-25 knots). But as soon as the winds extend above ~ 25 knots for any significant period of time, the quality of the data is rapidly compromised. The data quality appears primarily compromised as a result of bubble wash-down events (as expected for a flush mounted array on an ice-breaker hull). At the lower seastates, data quality at speeds up to 14 knots appear unaffected. At wind speeds above ~ 20 knots, until ~ 25 knots, slowing the vessel down to 8knots through the water appears to help. Above 25 knots, the data quality does not appear to benefit from further speed reductions. Above ~ 25 knots of sustained winds the data are generally unacceptable for either survey or science.

 Under the lower seastate conditions, the vessel can maintain a 4000-5000m swath at a depth of 2500m. Whilst this corresponds to a swath width of less than 50% of that of a typical 12 kHz system (+/-60 to 65  deg. sector), the data density is actually higher (2-4 x due to denser across track beam spacing and quicker pulse repetition rates).  The vessel thus clearly provides a usable deep-water mapping capability but under a reduced seastate and swath width capability. For open and ice-freewaters, she would thus not normally be a natural choice for mapping in depths greater than ~ 1500m. She is however the only multibeam-equipped icebreaker in Canada and is already committed to twice-annually steaming in transit through the Labrador Sea and Baffin Bay to meet her research committments in the high Arctic (including the Beaufort Sea). She thus has the advantage that her transit costs are already met and she is capable of surviving in ice-covered conditions (this brief report does not comment on data quality whilst actually ice-breaking).


Background

CCGS Amundsen is a 97m 1200 class icebreaker, originally built in 1984 and commissioned as the Sir John Franklin. In 2003 she was refit as an Arctic research platform under CFI funding. As part of that refit she was equipped with a Simrad EM300 30 kHz multibeam sonar. To survive  under ice-breaking conditions, the transmit and receive arrays are mounted almost flush with the hull and behind titanium-polymer windows. As expected, the custom ice-reinforced transducer mounting has restricted her performance in open ocean conditions. The figures below contrast the Amundsen mount (usable only up to seastate 5) with the gondola mount on the Ocean Alert (usable up to seastate 7).
alert
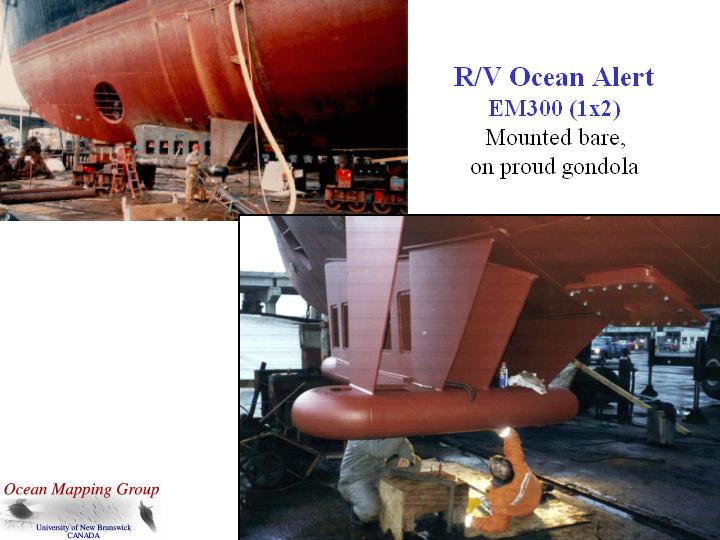
<< CCGS Amundsen EM300 transducer mount
flush to hull behind ice-reinforced windows

MV Ocean Alert EM300 transducer mount >>
on gondola, proud of hull, no acoustic windows
alert
She has now operated successfully for two field seasons in the high Arctic as part of the CASES and ArcticNet research programs. To date, the majority of the data collected by the Amundsen has been in depths less than ~ 600m in the channels of the Arctic Island Archipelago, the Beaufort Shelf and Hudson Bay. All that data can be viewed online at:

http://chamcook.omg.unb.ca/~arcticnet/

Because of the presence of ice and the limited fetch in those regions (both of which reduces seastate), the data are generally high quality unless the vessel is actually ice-breaking. The significant exception to all this was the extremely poor quality data collected during original transit in September 2003 through the Labrador Sea and Baffin Bay which was done at 14-16 knots during higher seastates (5+). No opportunity existed at that time to assess the sonar performance at slower speeds and at varying azimuths and seasates. The aim of these trials, on the return transit in October 2004 was to assess whether the system could provide useful data for continental margin mapping at slower speeds and or lower seastates, possibly in support of federal UNCLOS mapping programs.


Deep Water Results

mapFrom about 60.75 N until 56.60 N the Amundsen approximately tracked the 2500m contour (as derived from ETOPO5). The aim was to assess the bottom tracking performance of the flush-mounted, ice-reinforced EM300 system on the Amundsen under open ocean conditions. Whilst the data could be useful towards assessing the approximate location of the 2500m contour (and all the data is being made publicly available), no external funding was provided for these trials and thus the cost of the diverted transit was borne by 
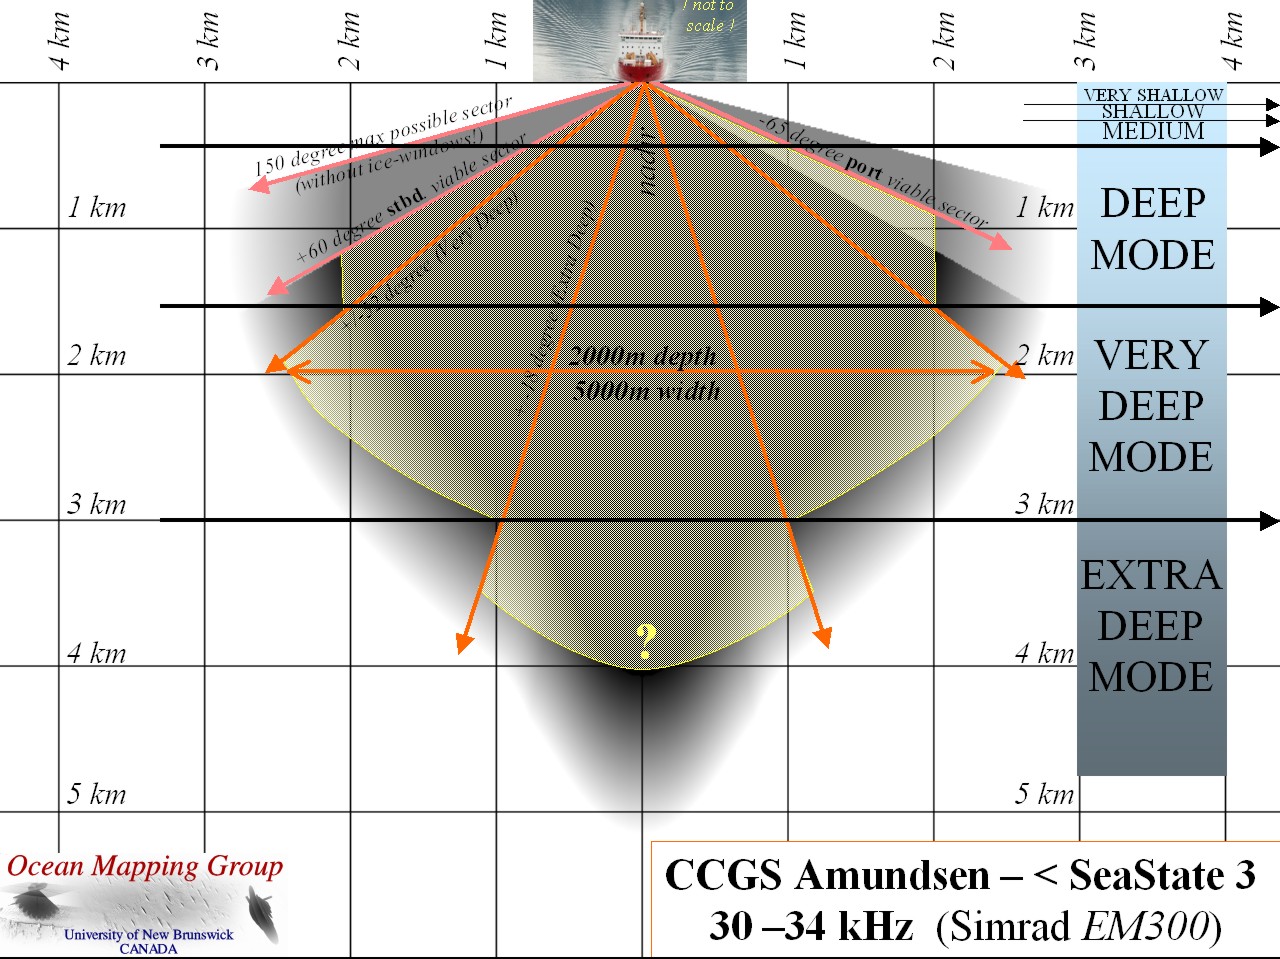
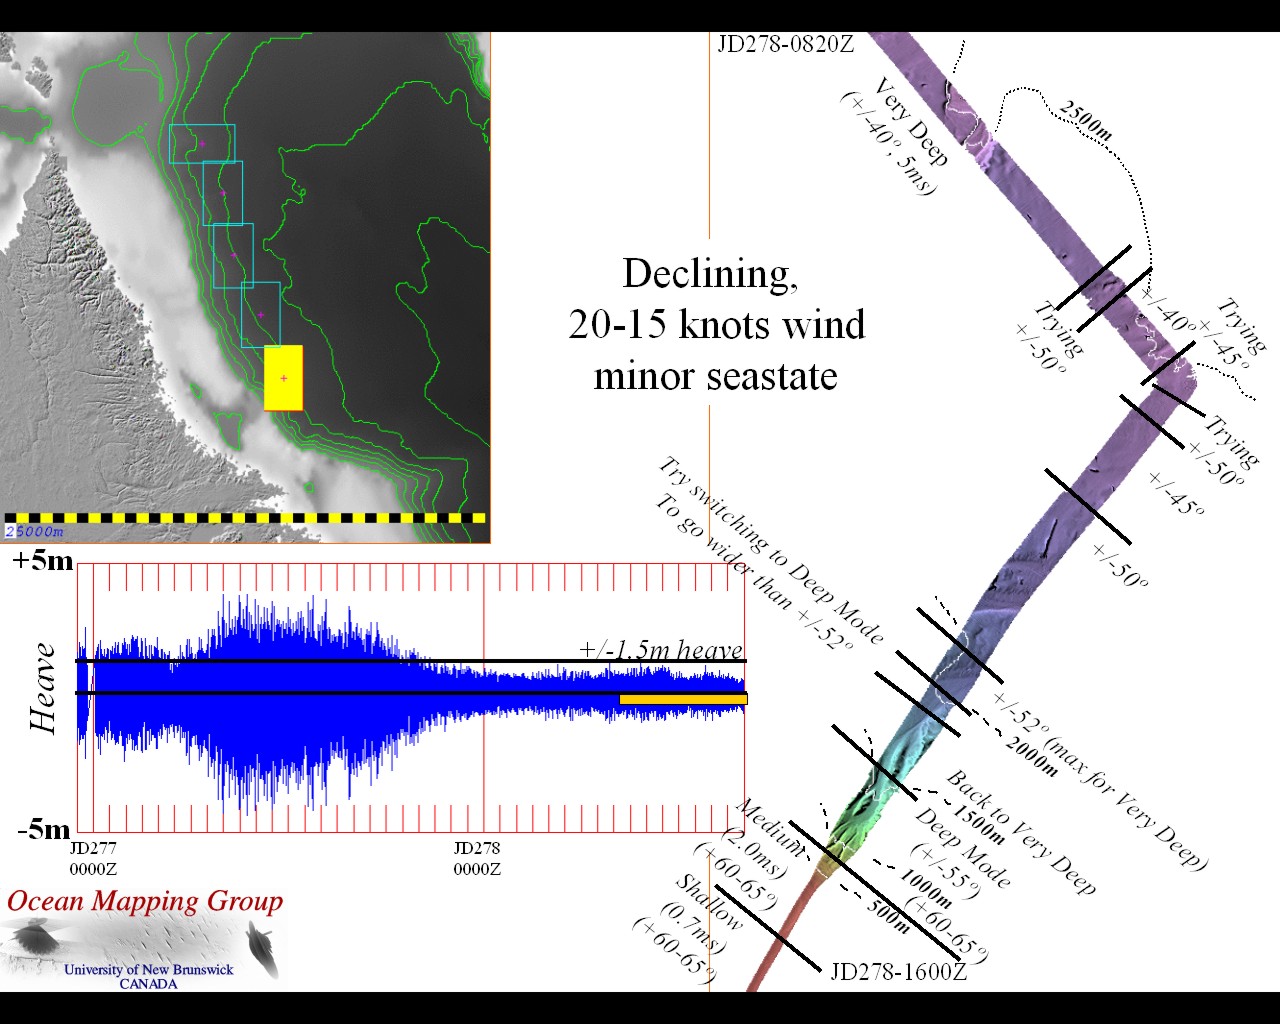
the ArcticNet research program.
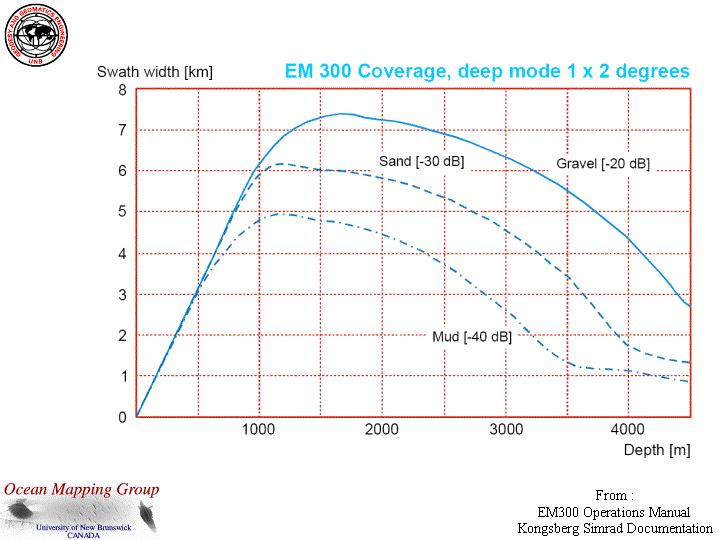
The data has been presented (see below) as 5 mapsheets created at 50m resolution. Each sheet covers approximately 80 x 135 km.  Note that 50m is at the limit of  reasonable achievable resolution of this sonar (a 1 degree transmit, 2 degree receive array pair) in these water depths. The beam footprints at nadir are 43m along track and 87m across track at these depths. When the sector is +/- 40 degrees (4200m swath), the 135 beams, distributed in equidistant mode are spaced at 31 m apart (not justified for amplitude detections, but plausible for phase detection). At the same sector, the system generally pings every ~ 5.4 seconds, resulting in an alongtrack beam spacing of 21m at 8 knots and 32m at 12 knots.

For each sheet, the time series of data presented is plotted with respect to the observed heave at the transducer (a reasonable and continuous proxy for seastate). As soon as the vessel cleared Cape Childey, she was operating in winds in excess of 30 knots. For a period of ~ 12 hours the winds were over 40 knots, but by the second half of the deep-water transit, the winds dropped below 20 knots.

Originally a series of trials were planned in which lines at various azimuths to the prevailing sea were planned. Unfortunately owing to time constraints and lack of funding, these were not conducted and so the vessel maintained a roughly southerly course at all times into the seas. Speeds were varied from 8 knots for most of the high sea state period to 12 knots in the lower seastates as she steamed up the slope towards Makkovik Bank. The results presented below, allow one to assess the achievable coverage as a function of seastate in these water depths.

simrad performanceThe main thing to note is that any EM300 is generally attenuation limited,even in low seastates at depths greater than ~ 1000m. Due to the ice-reinforced windows, steering beyond ~ 65 degrees, relative to the receive array is not possible anyway. As the array is tilted to port, standardly a sector of +(stbd) 60 degrees and -(port) 65 degrees is acquired in water depths less than 1000m.  At depths beyond ~ 800m, there are three ping modes:
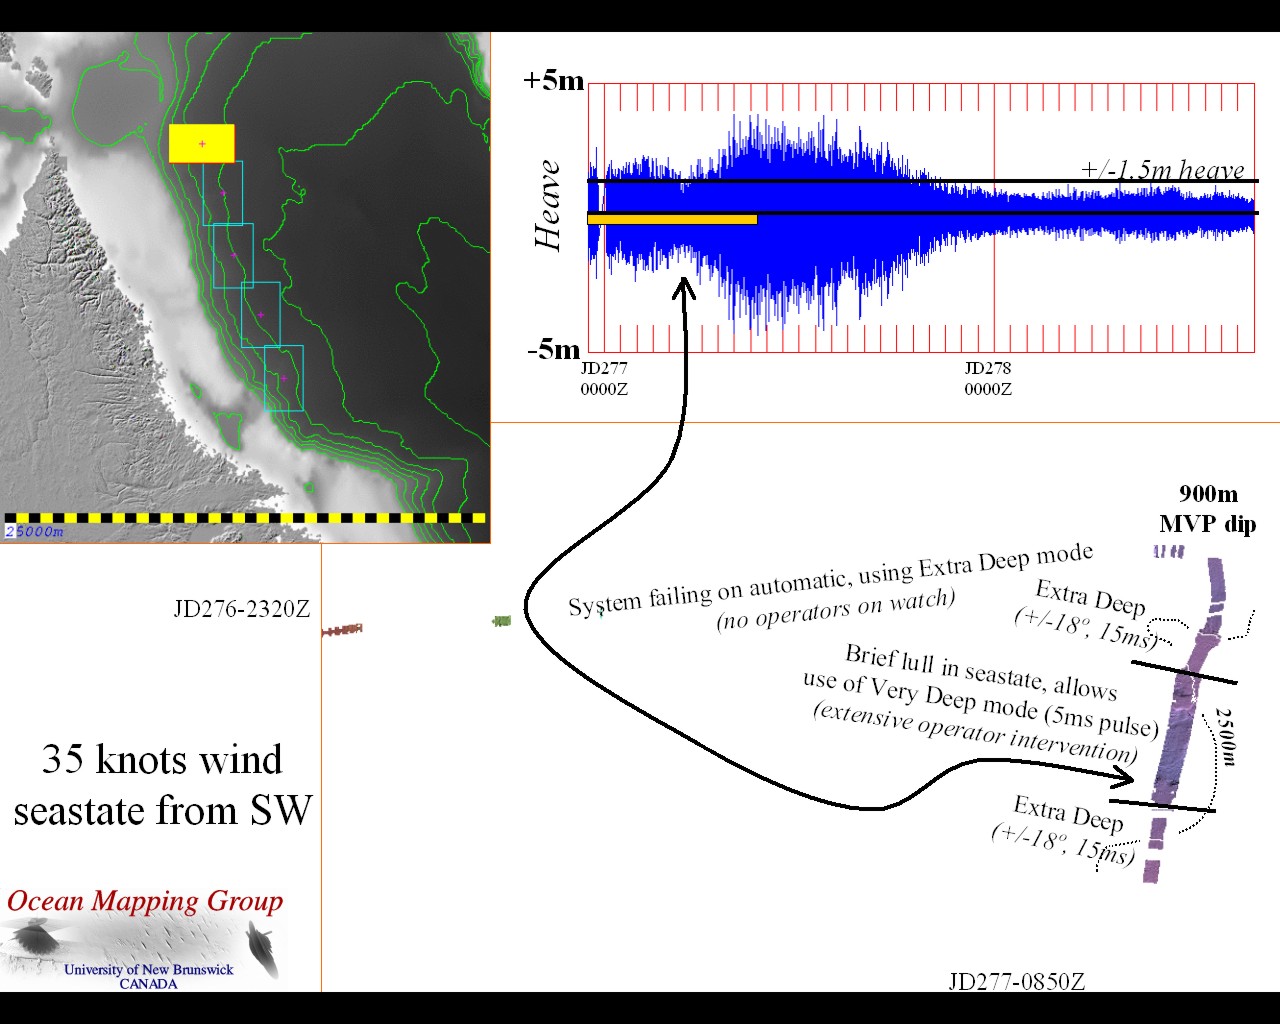
The predicted performance from Simrad documentation for a 1x2 degree array (without ice-windows) is shown to the right. Although the figure claims Deep mode, the deeper swath widths would need the Very Deep and Extra Deep modes.

For each of the sheets below, a slide image is presented to the left that has comments on the sonar settings and a correlation with the heave time series. To the right are two images of the 50m resolution backscatter mosaic and terrain model (so that resolution capability can be assessed). The link below each image leads to geotiff file for external registration..


slide
Section from the shelf break down to the 2500m contour.
35-40 knots winds,  ship speed 12 knots going east, 8 knots on heading south..

Lost tracking going down hill.  Could only maintain tracking by forcing longest pulse length (Extra Deep Mode) and manually setting depth gates based on 3.5 kHz record. Ridiculously small and poor quality swath so went to bed...
Deep water (900m) MVP dip at eastern end of line. On recommencing the survey, was able to track well in a short lull in the sea using Very DeepMode. But within 2 hours was forced back to using Extra Deep mode.
mosaic
bathy
slide
Northern section along the 2500m contour. 40 knots of wind. Ship speed 8 knots...

Confusion about what the depth range was likely to be for the first section. On forcing the gates to within ~+/-200m of the bottom, managed to start tracking, but only using Extra Deep Mode with resulting narrow swath and poor resolution.
Litttle, if any useful data, ridiculously narrow swath (Extra Deep mode is primarily designed for lower seastates but in far deeper waters (> 3500m).
Backscatter data of little use, clearly dominated by bubble wash down and signal to noise problems,
mosaic
bathy

slide
Central Section along the 2500m contour. Winds dropping ~ 35-25 knots.

Increasing bottom tracking quality. Switched to Very Deep Mode. Little improvement at first in swath width but much better resolution. Let the sonar system choose its own angular sector. As seastate moderated the sector naturally opened up. It is very clear that it is best to let the sonar choose the achievable swath width as it continually optimally redistributes the 135 beams over the maximum realistically achievable sector. An attempt to force a wider swath was met with a reduction in the total swath width.
Clear from the heave data that the sea was dropping and the swath gradually opened up. Nevertheless, whilst bathymetry is now usable, it is apparent that there is significant bubble wash-down, rendering the backscatter data unusable. Note that heavily manual editing has been performed on this section of data.
backscatter
bathy
slide
Southern Section along the 2500m contour. Winds continue dropping 25-20 knots.

Tracking markedly improving. A stable 4km swath now. Operating in Very Deep-mode, one can note from the backscatter that the incidences of bubble wash down are decreasing by the decrease in frequency of low backscatter striping in the imagery. The heave signal shows that the seas have descended far more rapidly, but that there must still be a lot of bubbles in the upper layer, masking the array.
The data cleaning requirements are now much less extreme and the backscatter data becomes acceptable by the end of the segment.
backscatter
bathy
slide
Section up Makkovik Margin- Winds 20-15 knots.

Excellent tracking using the full +/-52 deg. of the Very Deep Mode when shallower than 2000m.  Tried switching to Deep Mode as same pulse length to allow a wider sector. But clearly another factor as reduced swath width initially (broader receiver bandwidth perhaps ?). Switched to Deep mode permanently at the 1500m contour, and to Medium mode at the 700m contour.

Under these conditions, the swath widths achieved match closely the Simrad predictions for a muddy seabed, indicating that the attenuation due to the ice windows is not a particularily critical factor. Note also that the vessel has increased speed up to 12 knots for this up-margin section.
backscatter
bathy
slide Example data from 2000-2200m  using Very Deep Mode. 

A stable 5000m swath is being acquired, with little apparent loss of resolution from nadir to the far range. Excellent depiction of valley flow morphology and detail on the ridge-like feature. Note that the backscatter data has no evidence of any bubble wash down events.

50m contours superimposed.
coverage
Relative Coverage, Attenuation limited EM300 v. EM120

At 2500m, the EM300 swath is clearly attenuation limited with no more than a +/- 40 degree swath available. It is worth contrasting with the swath width that could be provided using a 12 kHz EM120. At these depths, the EM120 could potentially provide a +/- 75 degree swath. Exactly how wide a swath width could be used to achieve the required data accuracy, however, depends on external ancillary error sources including motion sensor accuracy and alignment and water column control.
Based on other deep water surveys, a realistic maximum sector used by a 12 kHz system would be  ~ +/-60 or +/- 65 ( an increase in coverage of more than a factor of 2.0 to 2.5 x). By comparison, the US UNCLOS surveys are being performed using three different 12 kHz sonars:
  • Arctic - Seabeam 2100 +/- 60 deg.
  • Atlantic - EM121 +/- 60 deg
  • Pacific - RESON 8150 +/- 45 deg
coverage Relative sounding density, EM300 v. EM120

Whilst a 12 kHz system would clearly provide a greater mapping (coverage) efficiency, it should be borne in mind that a wider swath sector would require both :
  • a wider spaced across track beam density  (beams have to spread over a wider sector) and
  • a wider along track beam density (longer two-way travel time to outermost beam)
In this case, the data density for an EM300 is between 2 and 4 time higher soundings per unit area. Thus, while it will achieve only a fraction of the coverage,  it should achieve (under low seastate conditions) a significantly greater spatial resolution than the wider swath 12 kHz systems.

In conclusion, the EM300 on the CCGS Amundsen provides a viable deep water mapping capability. The four main points to take note however are:
  1. MINUS -- less seastate capability     
  2. PLUS    -- no requirement for transit costs
  3. MINUS -- narrower swath width by a factor of 2 to 2.5
  4. PLUS    -- greater beam density by a factor of 2 to 4


created by JEHC, October 30th 2004