Nuliajuk in
                  Kangert
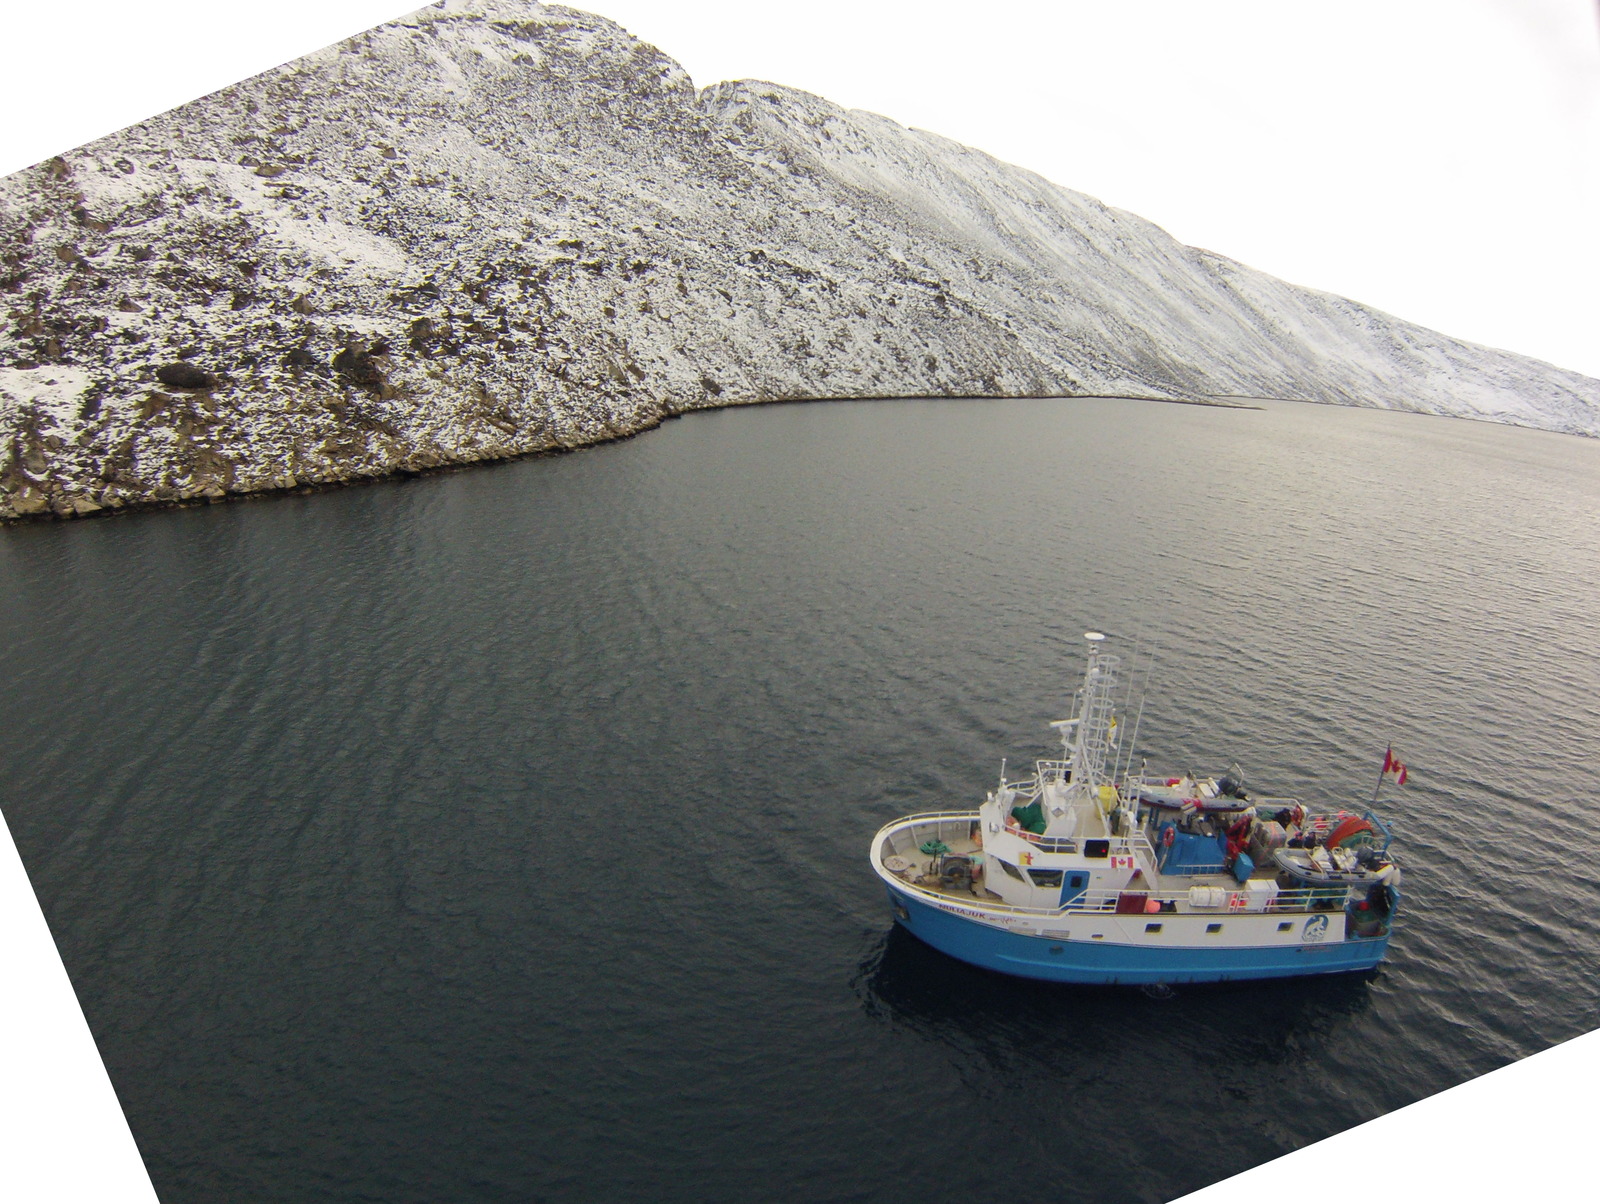
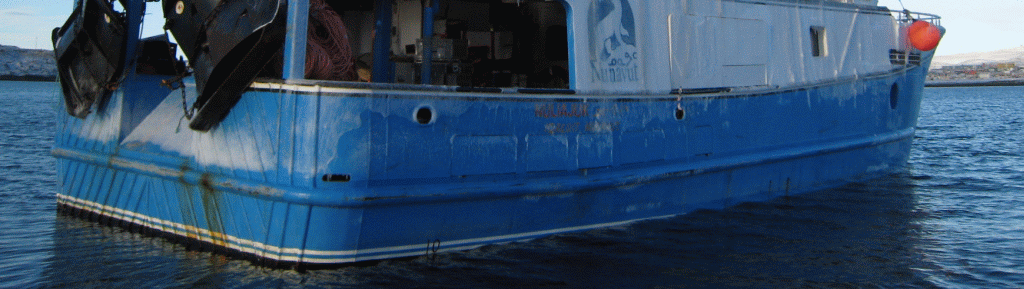
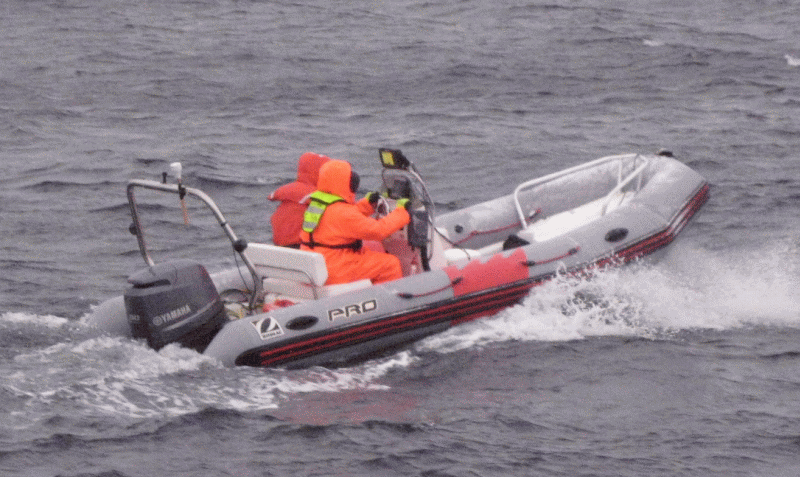
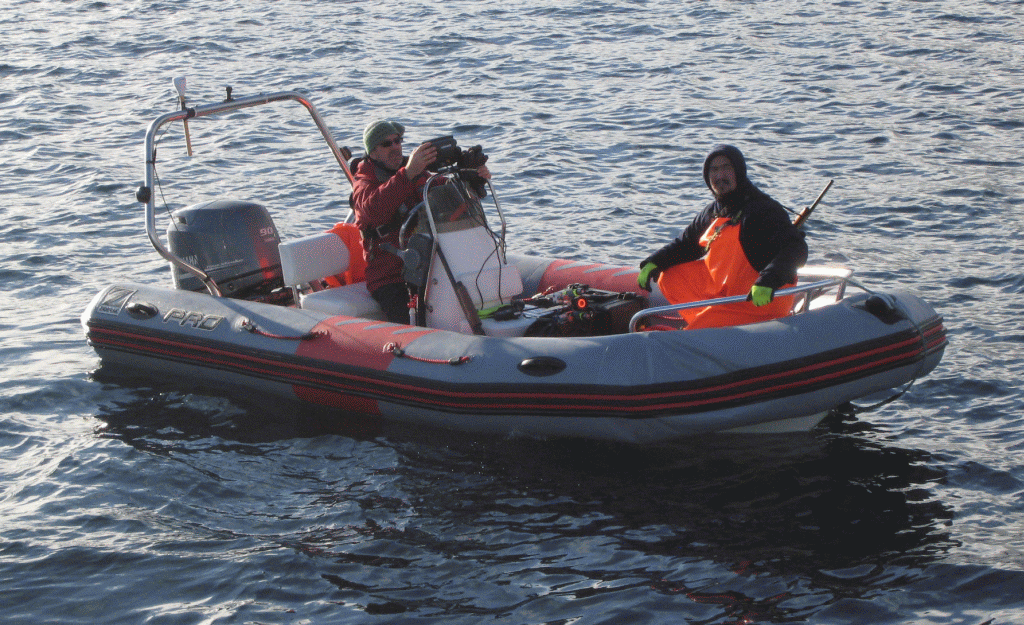
photo credit: James Muggah
Nuliajuk 2013 Instrumentation

John Hughes Clarke and James Muggah
Ocean Mapping Group
Dept. Geodesy and Geomatics Engineering
University of New Brunswick

Nuliajuk 2013 Index

The web page presents the seabed mapping instrumentation aboard the MV Nuliajuk.

Instrumentation:

Multibeam:
The primary means of collecting bathymetric data is a 300 kHz Kongsberg EM3002 multibeam. In more southerly waters these system are typically used to ~150m depth. In the cold brackish water of the SE Baffin Island, increased performance has been noted due to lower attenuation and high bottom backscatter strengths. Bottom tracking to ~ 250-320m is routinely achievable. Nevertheless, depths exceeding this range are common. 
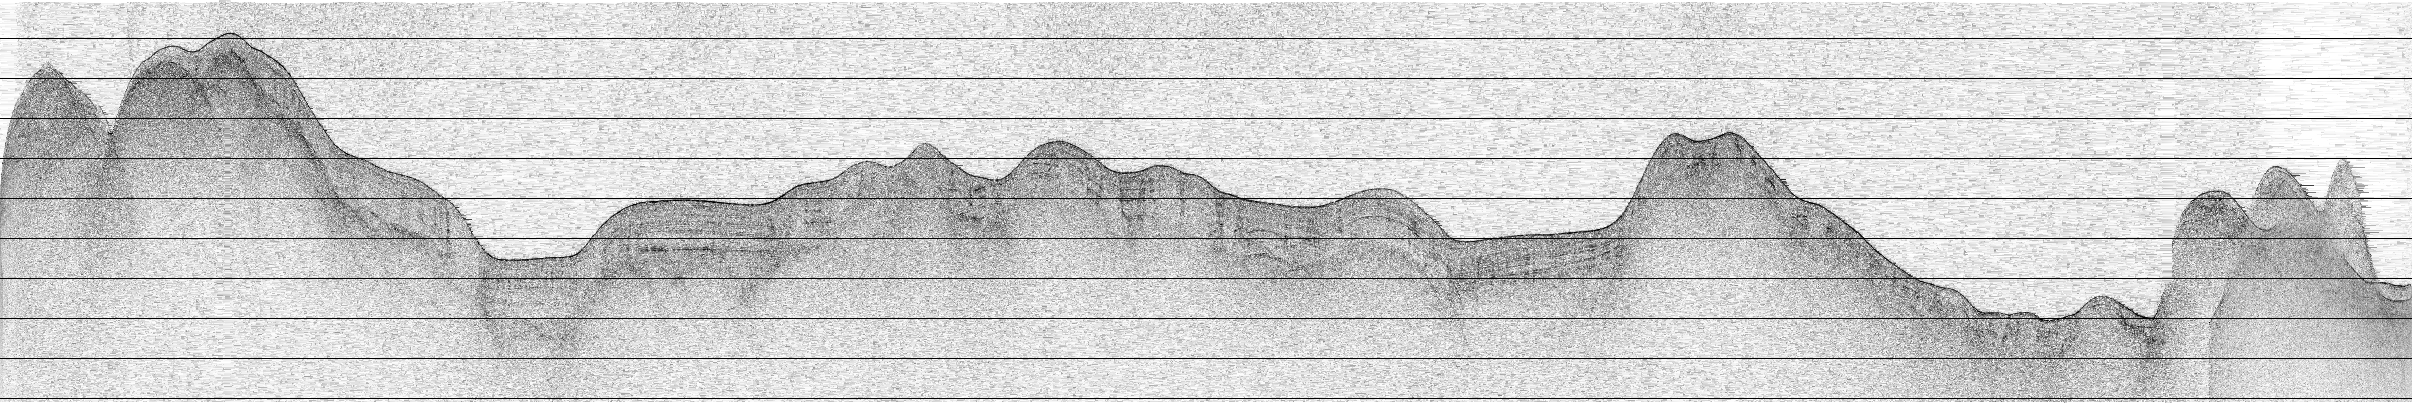
Primary positioning is provided by the F-185 on COM1 (GGA, HDT, VTG, ZDA) at 1 Hz
Attitude and orientation is provided by the F-185 on COM2 in EM1000 format at 100 Hz
Secondary positioning is provided by the C-Nav 3050 on COM2 in NMEA (GGA, VTG, ZDA) at 1 Hz
Timing is provided by the F-185 via ZDA and 1PPS (Falling Edge)
Single Beam:  a 38 kHz Furuno FCV-30 is the standard fisheries echosounder on the Nuliajuk. It is capable of bottom tracking in excess of 1500m. It is a split beam system, and also capable of forming multiple simultaneous beams (up to 5) for fish school shape determination. For fisheries biomass, the full waveform of a single channel can be exported in the HAC format. No bottom tracking is maintained in the HAC format, however, (or heave or orientation). And when recording to an external disk (the internal disk is too small), it slows down the ping rate and often freezes the sonar for up to a minute at a time.  Thus for this leg, full waveform logging was not used.

In survey mode, bathymetric bottom tracking data is available for a single channel. The NMEA DPT strings are logged by the Aldebaran system on board. interleaved with the ship's Furuno GPS system generating ZDA, GLL and VTG strings. The raw data are in uncorrected metres assuming 1500m/s and no draft. Although the system is stated to have an internal heave correction capability, it is clear that the data is not heave corrected. As the data is time stamped, the F-185 heave could be applied in post processing if desired.

For this year's survey operations, these data are only used in depths greater than ~ 250m where the EM3002 bottom tracking is lost.

Subbottom Profiler:
A Knudsen K3200 2kW, 2 element 3.5 kHz subbottom profiler was run continuously this season with a few exceptions. A new long pulse transmitter module (LPTM) was required after the board failed on July 13th. This was the second time the LPTM was replaced (first was in October 2012). The LPTM was replaced on October 2nd. The failure of the AC/DC power converter failed in the initial stages of the SE Baffin leg 1 cruise (October 6th). The Knudsen was unavailable until a new AC/DC power converter was installed on October 23rd. From October 28th onward however, intermittent failures of the Knudsen PC terminated the logging.
A 16ms FM pulse was used (5kHz bandwidth) on power level 1 for most of the data collection.
The system received the F-185 positioning and is heave corrected using the same source. A sample profile, collected off Hill Island, Frobisher Bay, is shown below.

example 3.5 kHz
Example of 3.5 kHz subbottom profiler record
Western Iqaluit Anchorage - JD303 - ~150m depth - 10m contour lines


Searchlight Sonar:
A Furuno CH-300 searchlight sonar system operating at either 85 kHz ("low") or 215 kHz ("high") is installed on the Nuliajuk. This is an essential component for safely surveying in uncharted waters. It was standardly used in HF mode as it is not synchronizable and this minimized interference with the EM3002. The LF is only required for ranges in excess of 500m anyway. It was routinely used on a 200m range using horizontal scan at a user-selectable depression angle (typically 5° to 10° examining 17 to 35m depths) . A forward looking +/- 48°  sector was used to monitor upcoming shoals in that depth range.
The system uses a mechanically tilted and rotated pencil beam  with a beamwidth of 4.5° at HF (10.5° at LF).  The beam is rotated in 6° steps, taking around 5 seconds to complete one 96° scan at 200m range.
This system provides the means to robustly detect upcoming shoals at a distance of 150m+ so that there is adequate time to turn or stop the vessel. Due to the rocky and unpredictable nature of the submerged geomorphology in the SE Baffin Island area, without this system, almost none of the operations in uncharted waters would have been attempted.

Positioning and Correctors: 
CNav 3050 and 2000 GNSS Receivers are the prime source of precise positioning available onboard.  Real-time RTG output from the 3050 is available and the 3050 also generates RTCM differential corrections for the inertially-smoothed GPS solution from the F-185. Both the 3050 and the 2000 raw pseudo-range observations are logged for PPP or PPK post processing.
CNAV 2000: The output is recorded using a serial logger. The logged data is converted to Rinex format using a proprietary CNAV converter that must be run on 32-bit Windows. Files are split by the serial logger 24 hours from logging start.

CNAV 3050: Is the secondary positioning for EM3002 and provides RTCM correctors to F-185. Logged by C-Setup to a proprietary format. Can be converted to Rinex with C-Nav converter.
COM1: configured to output GGA, VTG, ZDA at 1 Hz, supplied to EM3002 as secondary positioning.
COM2: configured to output RTCM 9 correctors to the F-185
Positioning and Orientation: 
A CODA Octopus F-185 GPS-aided inertial navigation system provided 100 Hz orientation and 1Hz position.The position is an inertially-smoothed differential solution reduced to the vessel RP. Roll and Pitch accuracy are reported at the ~0.025° range (1 sigma). The heading accuracy is supposed to be at the  0.05° level.  Real time heave is reported to be at the 5cm or 5% of range scale. However, as with other real-time heave solutions, long period drifting of the real time solutions over time scales of a minute or more at a level of 5-15cm is common after manoeuvres. The F-185 also provides a delayed heave solution ("iHeave") which is continuously logged asynchronously with the GF-185 mcom files. Should it be desired, those heave solutions could be substituted.


Sound Speed: 
 Typically one SVP per day was collected. An AML SVPlus (SN3310), on loan from the CHS was used which records pressure, sound speed and temperature. From this the salinity was back-calculated. Given that the daytime air temperatures are now below zero, almost all river runoff has ceased. Below ~ 5 metres the water mass was almost entirely invariant. Beyond the maximum depth of a dip (ranging from 60 to ~ 360m) the deepest temperature and salinity reading was combined with a 300 to 500m decibar pressure to estimate  the sound speed at that depth. The Simrad S01 format TSV file was transmitted to SIS so that, as well as an asvp profile a valid attenuation coefficient file was generated.

On the gondola, an AML SV and T probe was installed providing 1Hz readings continuously. A 60 second long median filter of those 1HHz values was used to perform beam steering.
As a backup, a Castaway TSZ probe, usable to 100m was available.

SE Baffin CTD
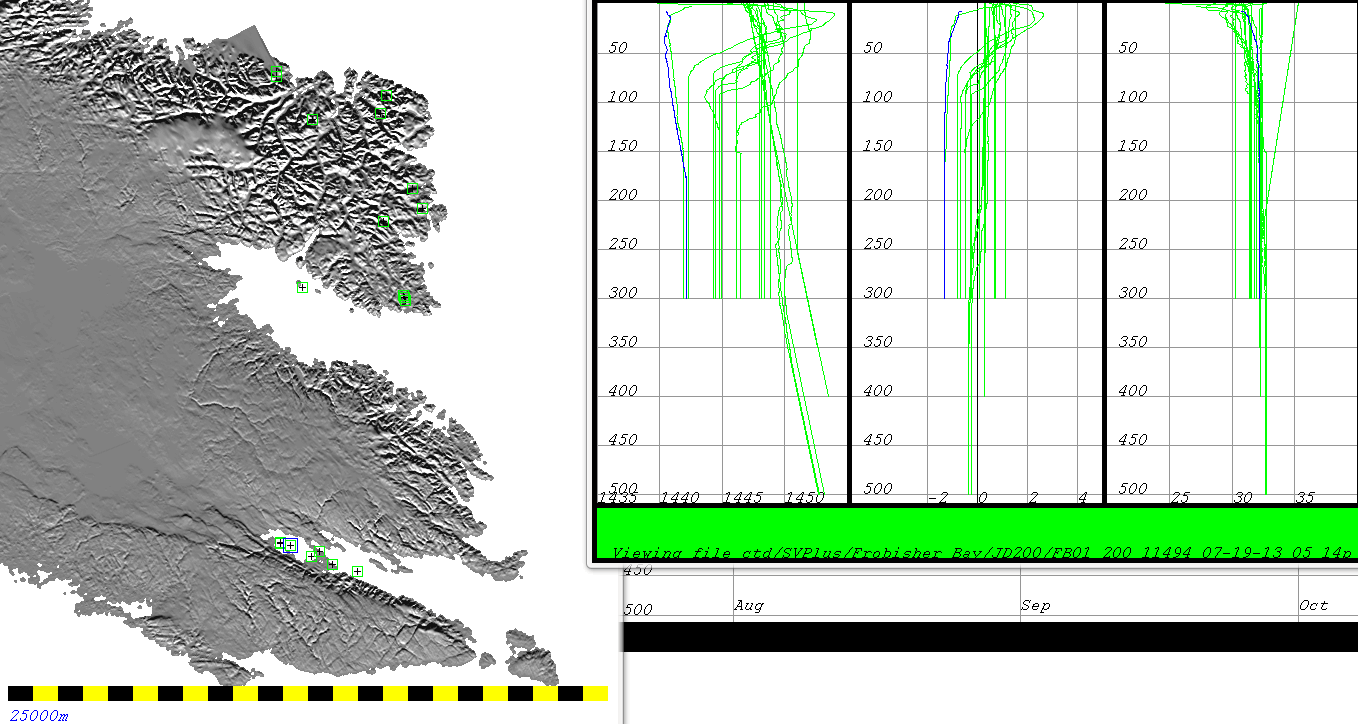
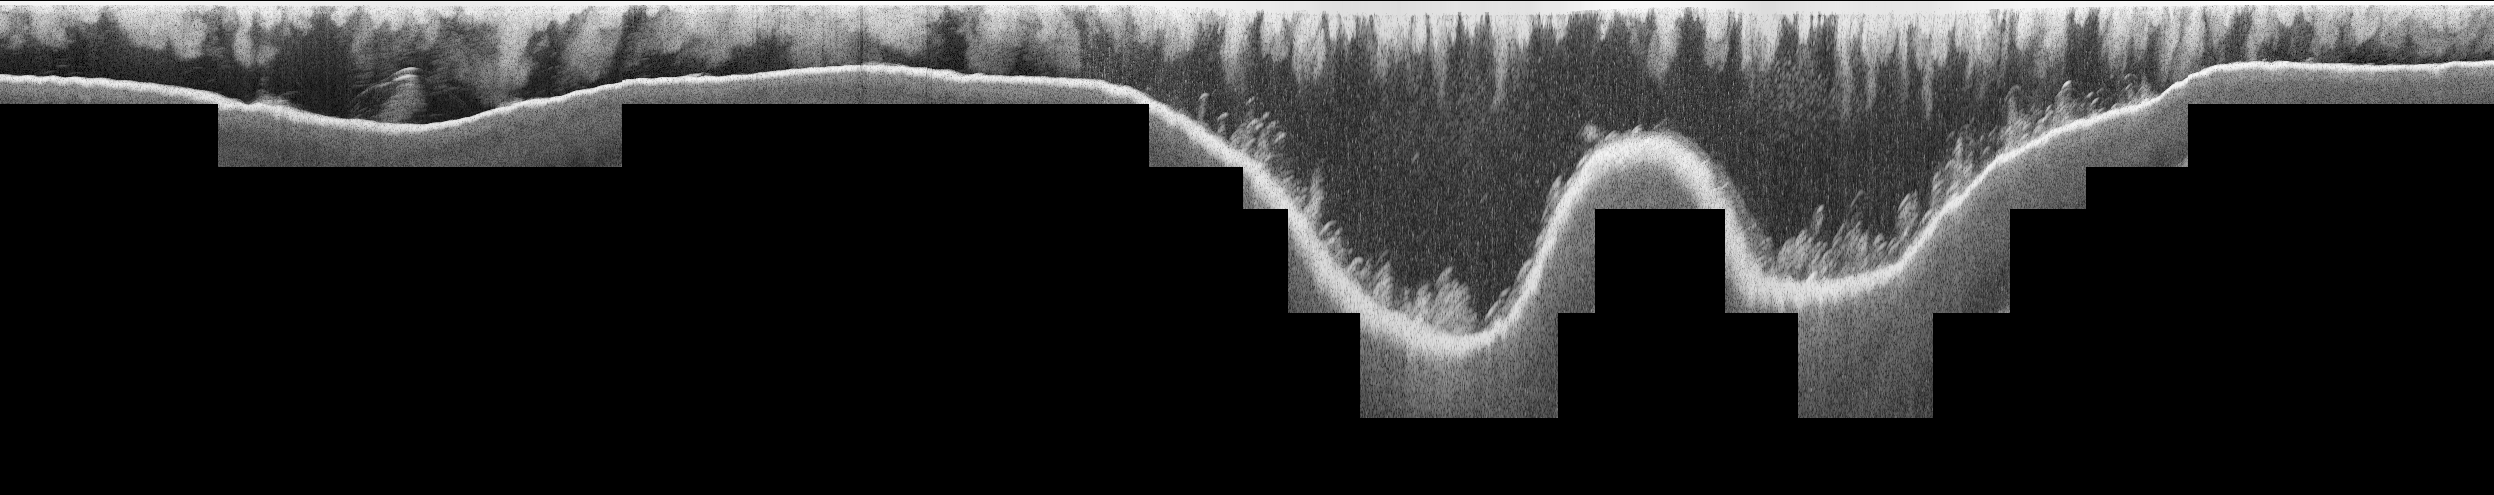
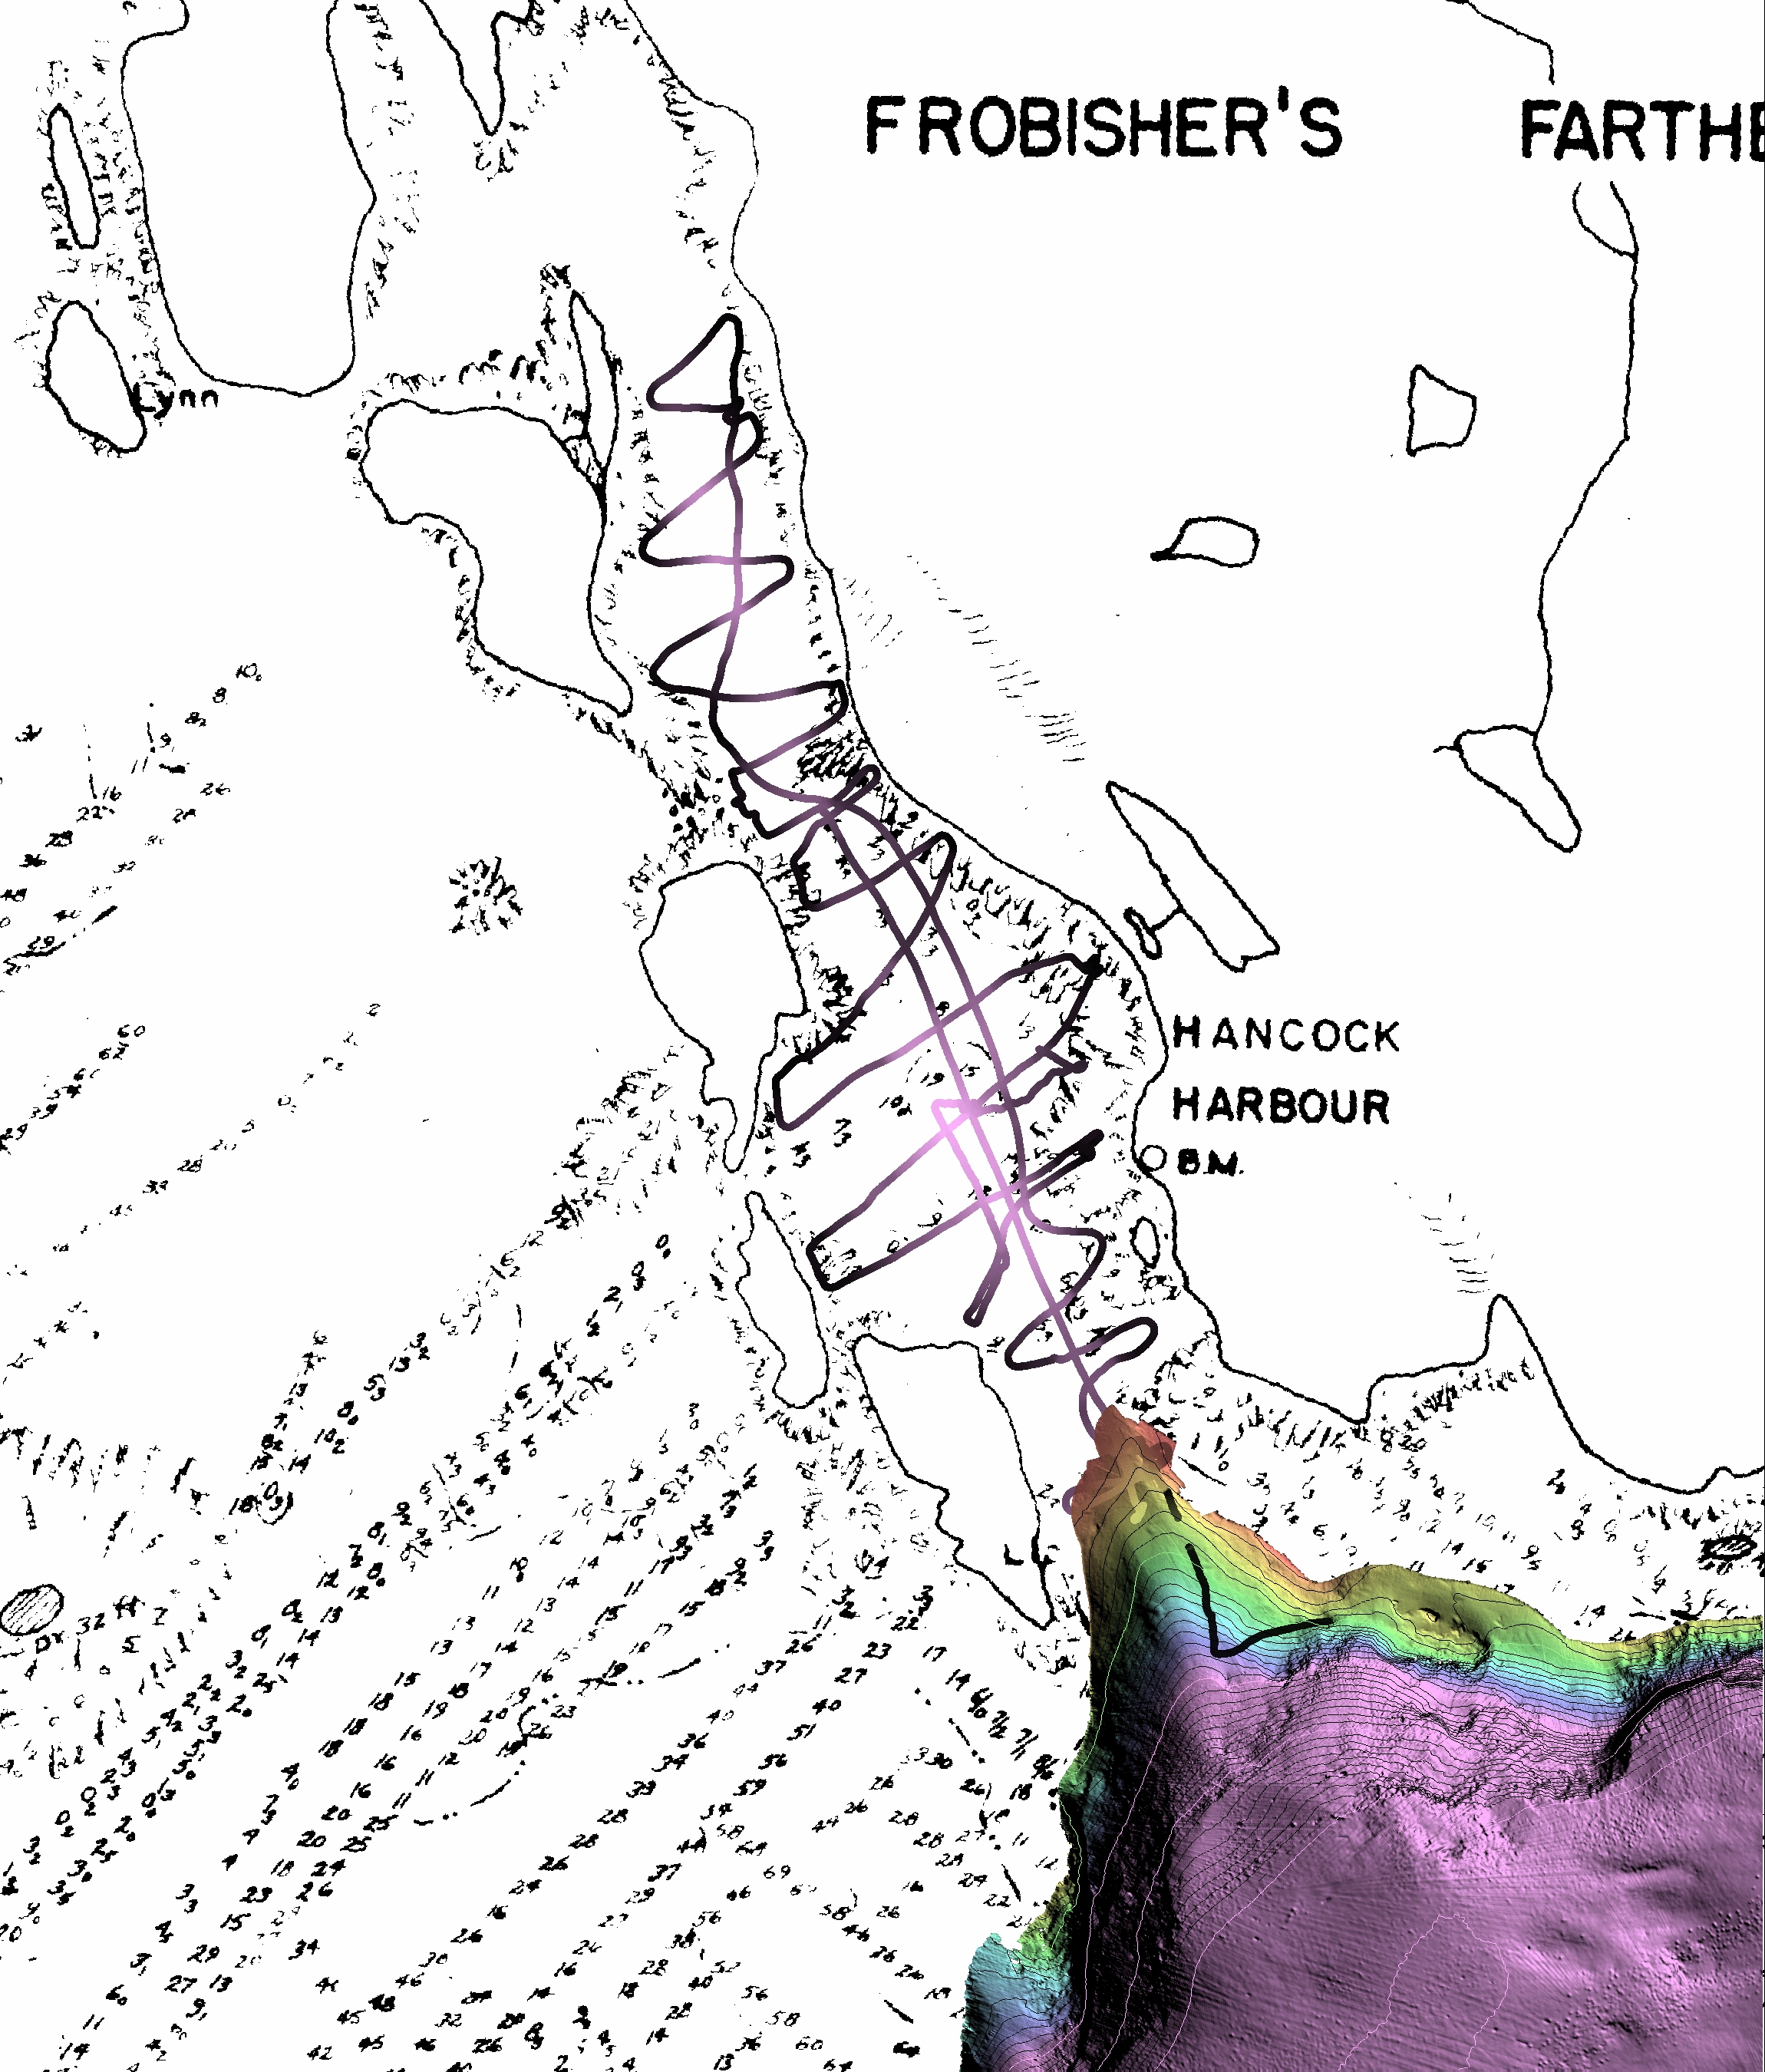
All 19 SV-T-S(derived) profiles obtained around SE Baffin Island and map showing locations of the SV profiles collected.

Lever Arms, Reference Frames:
The Ship's Reference Frame (SRF) was established by a static survey while the vessel was in dry-dock The survey, performed by Anand Hiroji and James Muggah in May 2013, used the IMU mounting plate as the Reference Point (RP). The RP local level was established as parallel to a surface defined by a series of bollard tops (the vessel wasn't level in dry-dock).  The EM3002 is  mounted pitched up 1.98°  w.r.t the SRF but is assumed to be aligned with the reference frame in heading and roll. Any subsequent angular discrepancies noted in the patch test are assumed to be a result of the F-185 IMU body misalignment with the SRF.

The following offset were entered into the SIS installation fields for the Lake Melville Surveys:
The following offset are entered into the SIS installation fields:
The primary positioning came from the F-185 which outputs an inertially smoothed trajectory of the RP.

Draft Estimates:
These are entered as the elevation of the RP with respect to the nominal waterline (WLZ). For all operations, the waterline is assumed to be the top of the white painted band. Forward, that band submerges and aft it is emergent (i.e.: static nose-down trim of the vessel) as illustrated in the photos below. Throughout the 4 week period in October, the draft was not observed to significantly change (<~0.10m). The vessel was refueled at Qikiqtarjuaq and again at Pangnirtung.

The following photos were taken at the end of the cruise showing the location of the top of the white waterline (the RP to WLZ reference used). The vessel is slightly heeling to starboard. The waterline top drops towards the bow and meets the actual waterlevel at about the location of the RP ((roughly below the porthole location).
port side
rear
stbd side
port side waterline   
stern waterline
    stbd side water line


On the last day 30th October, (JD303), squat trials were conducted. Weston Renoud will be analyzing the resultant RP PPK trajectories (Iqaluit has a permanent observing base-station)  to to see if any squat trends can be observed from 0 to 8 knots.

Lowrance Single Beam: A Lowrance single beam sounder was used from the larger RIB for the Aktijartukan Fjord, Kekerten Harbour and Hancock Harbour surveys and revealed the potential of using the RIB as an inshore survey and shoal investigation tool. A custom conversion program was written to take the position, bottom track and echo trace into the OMG Knudsen format for post-processing. As well as confirming the validity of the bottom track, the echo-trace seems promising for seabed vegetation studies (see figure below).

Lowrance Trace
Lowrance Digital Echo Trace - showing seabed vegetation (and surface bubbles from breaking waves).
Three sections across Hancock Harbour, 29th October 2013.

rib
would be better with a cuddy...      
rib
   showing transceiver/display mounting
ribmount
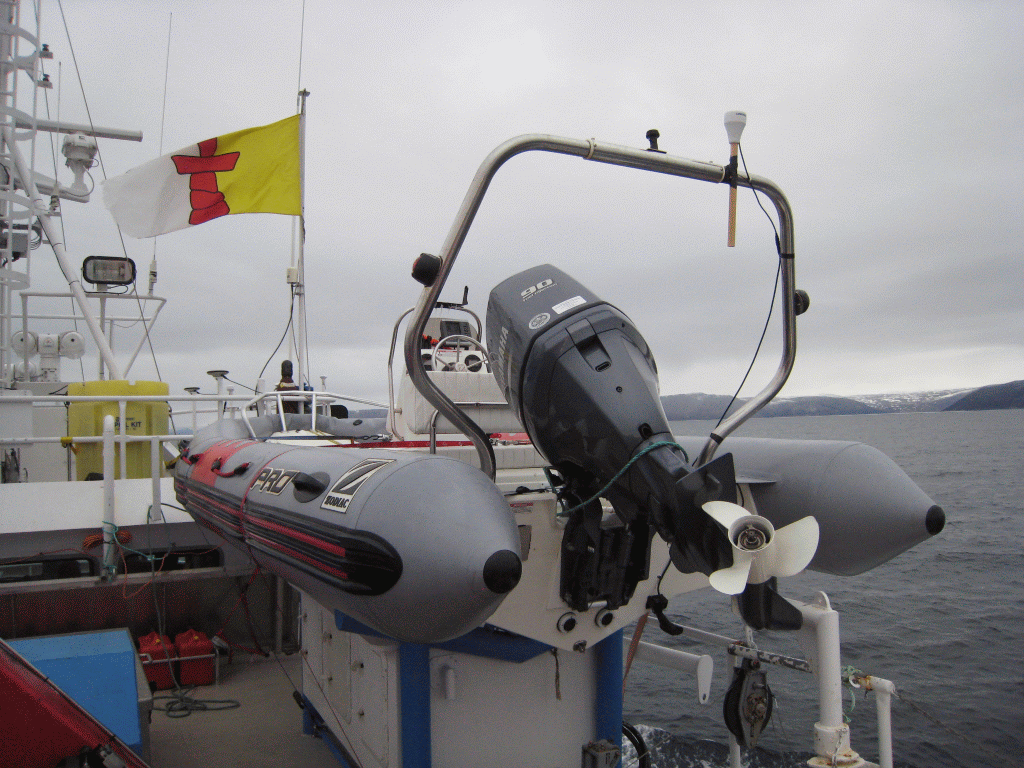
showing antenna and transducer transom setup. 
rib mount
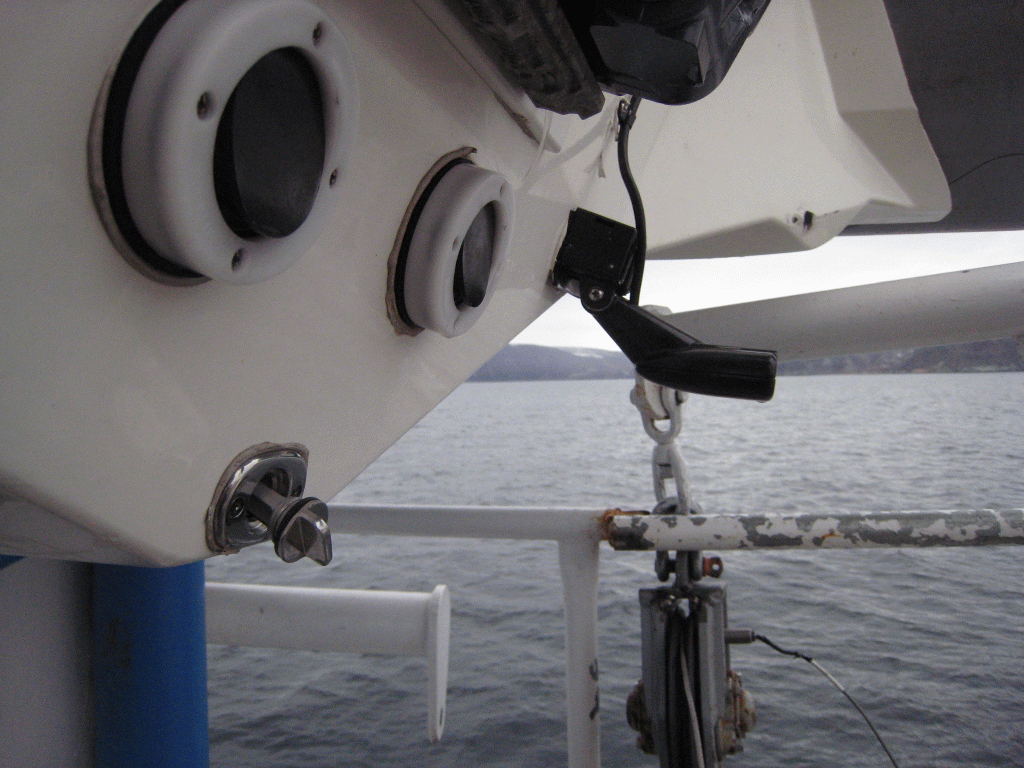
    showing detail of transducer installation
Hancock Coverage


The Lowrance logs a 3200 byte echo trace with an associated depth, position and time. The time, however, is relative to the start of logging, so either a waypoint must be made at that point or the time manually recorded. The only reason for a time fix is for tidal reduction. There is no heave input and the draft offset has to be added after the fact. It is not yet clear what sound speed is used in the range estimation.

The RIB single beam is a useful tool for establishing depths in waters too shallow or constricted for the Nuliajuk to safely operate. On SE Baffin leg 2, the system was used just once in Hancock Harbour. The figure to the left  shows the achieved sounding coverage (plotted with respect to the 1958 sounding sheet).

One option being considered for the 2014 field season is to install a small swath system on the RIB to improve the usefulness of the data that can be collected.


Tidal Reduction/Vertical Referencing:

As with standard ArcticNet survey procedures, our prime source of vertical referencing is to use the DFO WebTide. This provides a Mean Sea Level (MSL) referenced elevation. Webtide is designed to optimally reproduce tidal constituents at previously observed stations around the Arctic. It will not, therefore, account for any non-tidal water level forcing. It does however, elegantly cope with the rapidly varying amplitude and phase of the tide around the SE Baffin peninsula.

The newer Arctic9 model does resolve Frobisher Bay (left figure below). The previous edition (Arctic8) specifically excluded Frobisher Bay (central figure below). The default approach for OMG processing is to select the nearest node of one of the three available WebTide models that cover the archipelago (Arctic8 or 9, Hudson Bay and NW Atlantic). When a vessel position is within the mesh, it would make more sense to perform inter-node interpolation, but as the mesh extents do not cover all of the inshore (cutting off small inlets), the nearest option ensures that the mesh edges are extrapolated into those inlets. The degree of extrapolation needs to be limited however. Particularly for the case of Frobisher Bay as it would be worse to apply a grossly extrapolated Hudson Bay or NW Atlantic model inside Frobisher Bay, than to apply no tide at all. Thus a series of model-specific masks, defining the allowable limits of extrapolation, are used for all ArcticNet WebTide processing (right figure below). As can be seen, prior to 2012, Frobisher Bay was specifically excluded from application of any tidal model.

Up to the end of the 2011 field season, the Arctic8 model was used for all ArcticNet extrapolations. Therefore all Amundsen data inside Frobisher Bay have not had any tide applied. Only with the 2012 and now 2013 field seasons, has the Arctic9 model been used for multibeam data collected within Frobisher Bay. Therefore, it is recommended that those Amundsen data be identified and reprocessed with the Arctic9 model. All Amundsen data included and presented in the SE Baffin Leg 2 report have had that done. But this needs to be applied to the public online distribution.

Webtide All
Arctic 9 (yellow), NW Atlantic (blue) and
Hudson Bay (red) models are shown for
SE Baffin Island.

arctic9
arctic8
choice map
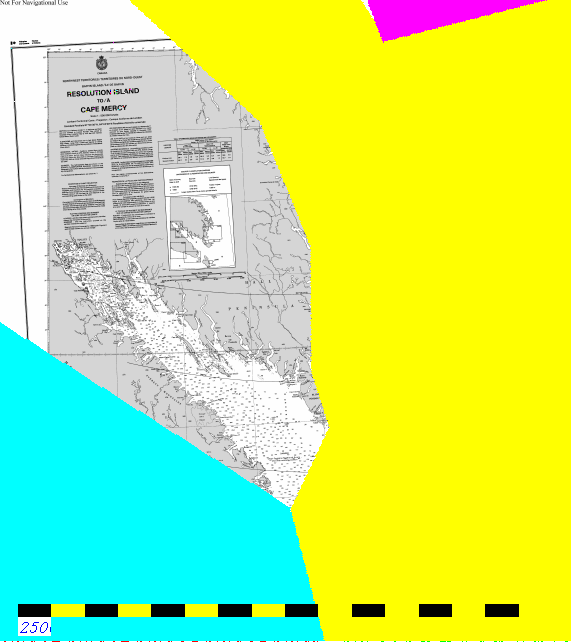
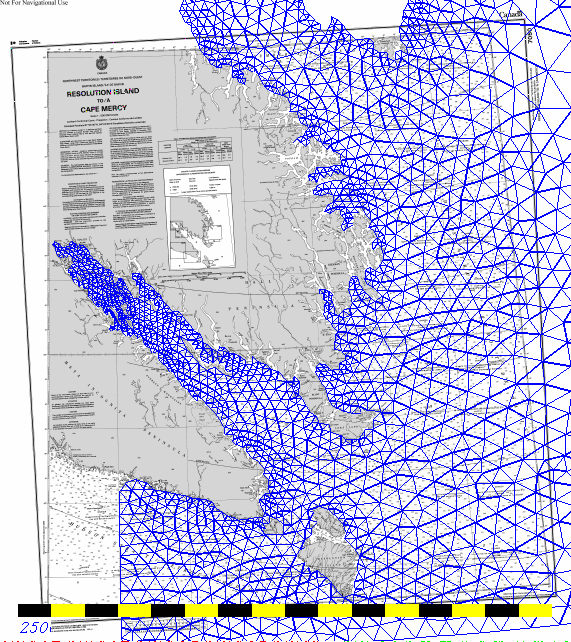
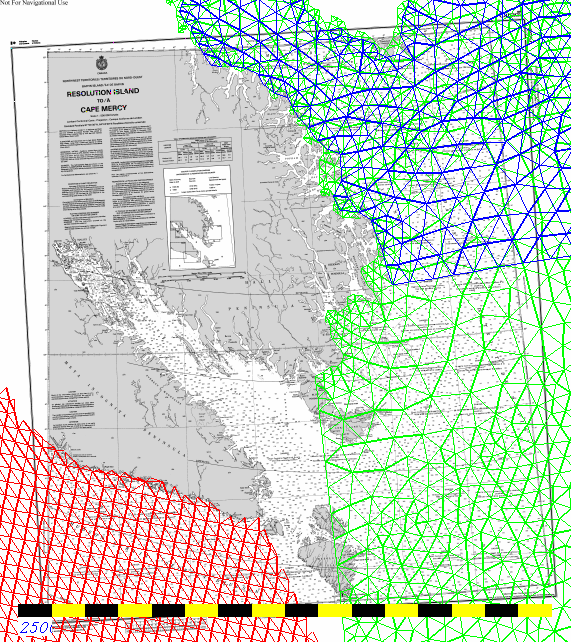
Arctic9 model coverage
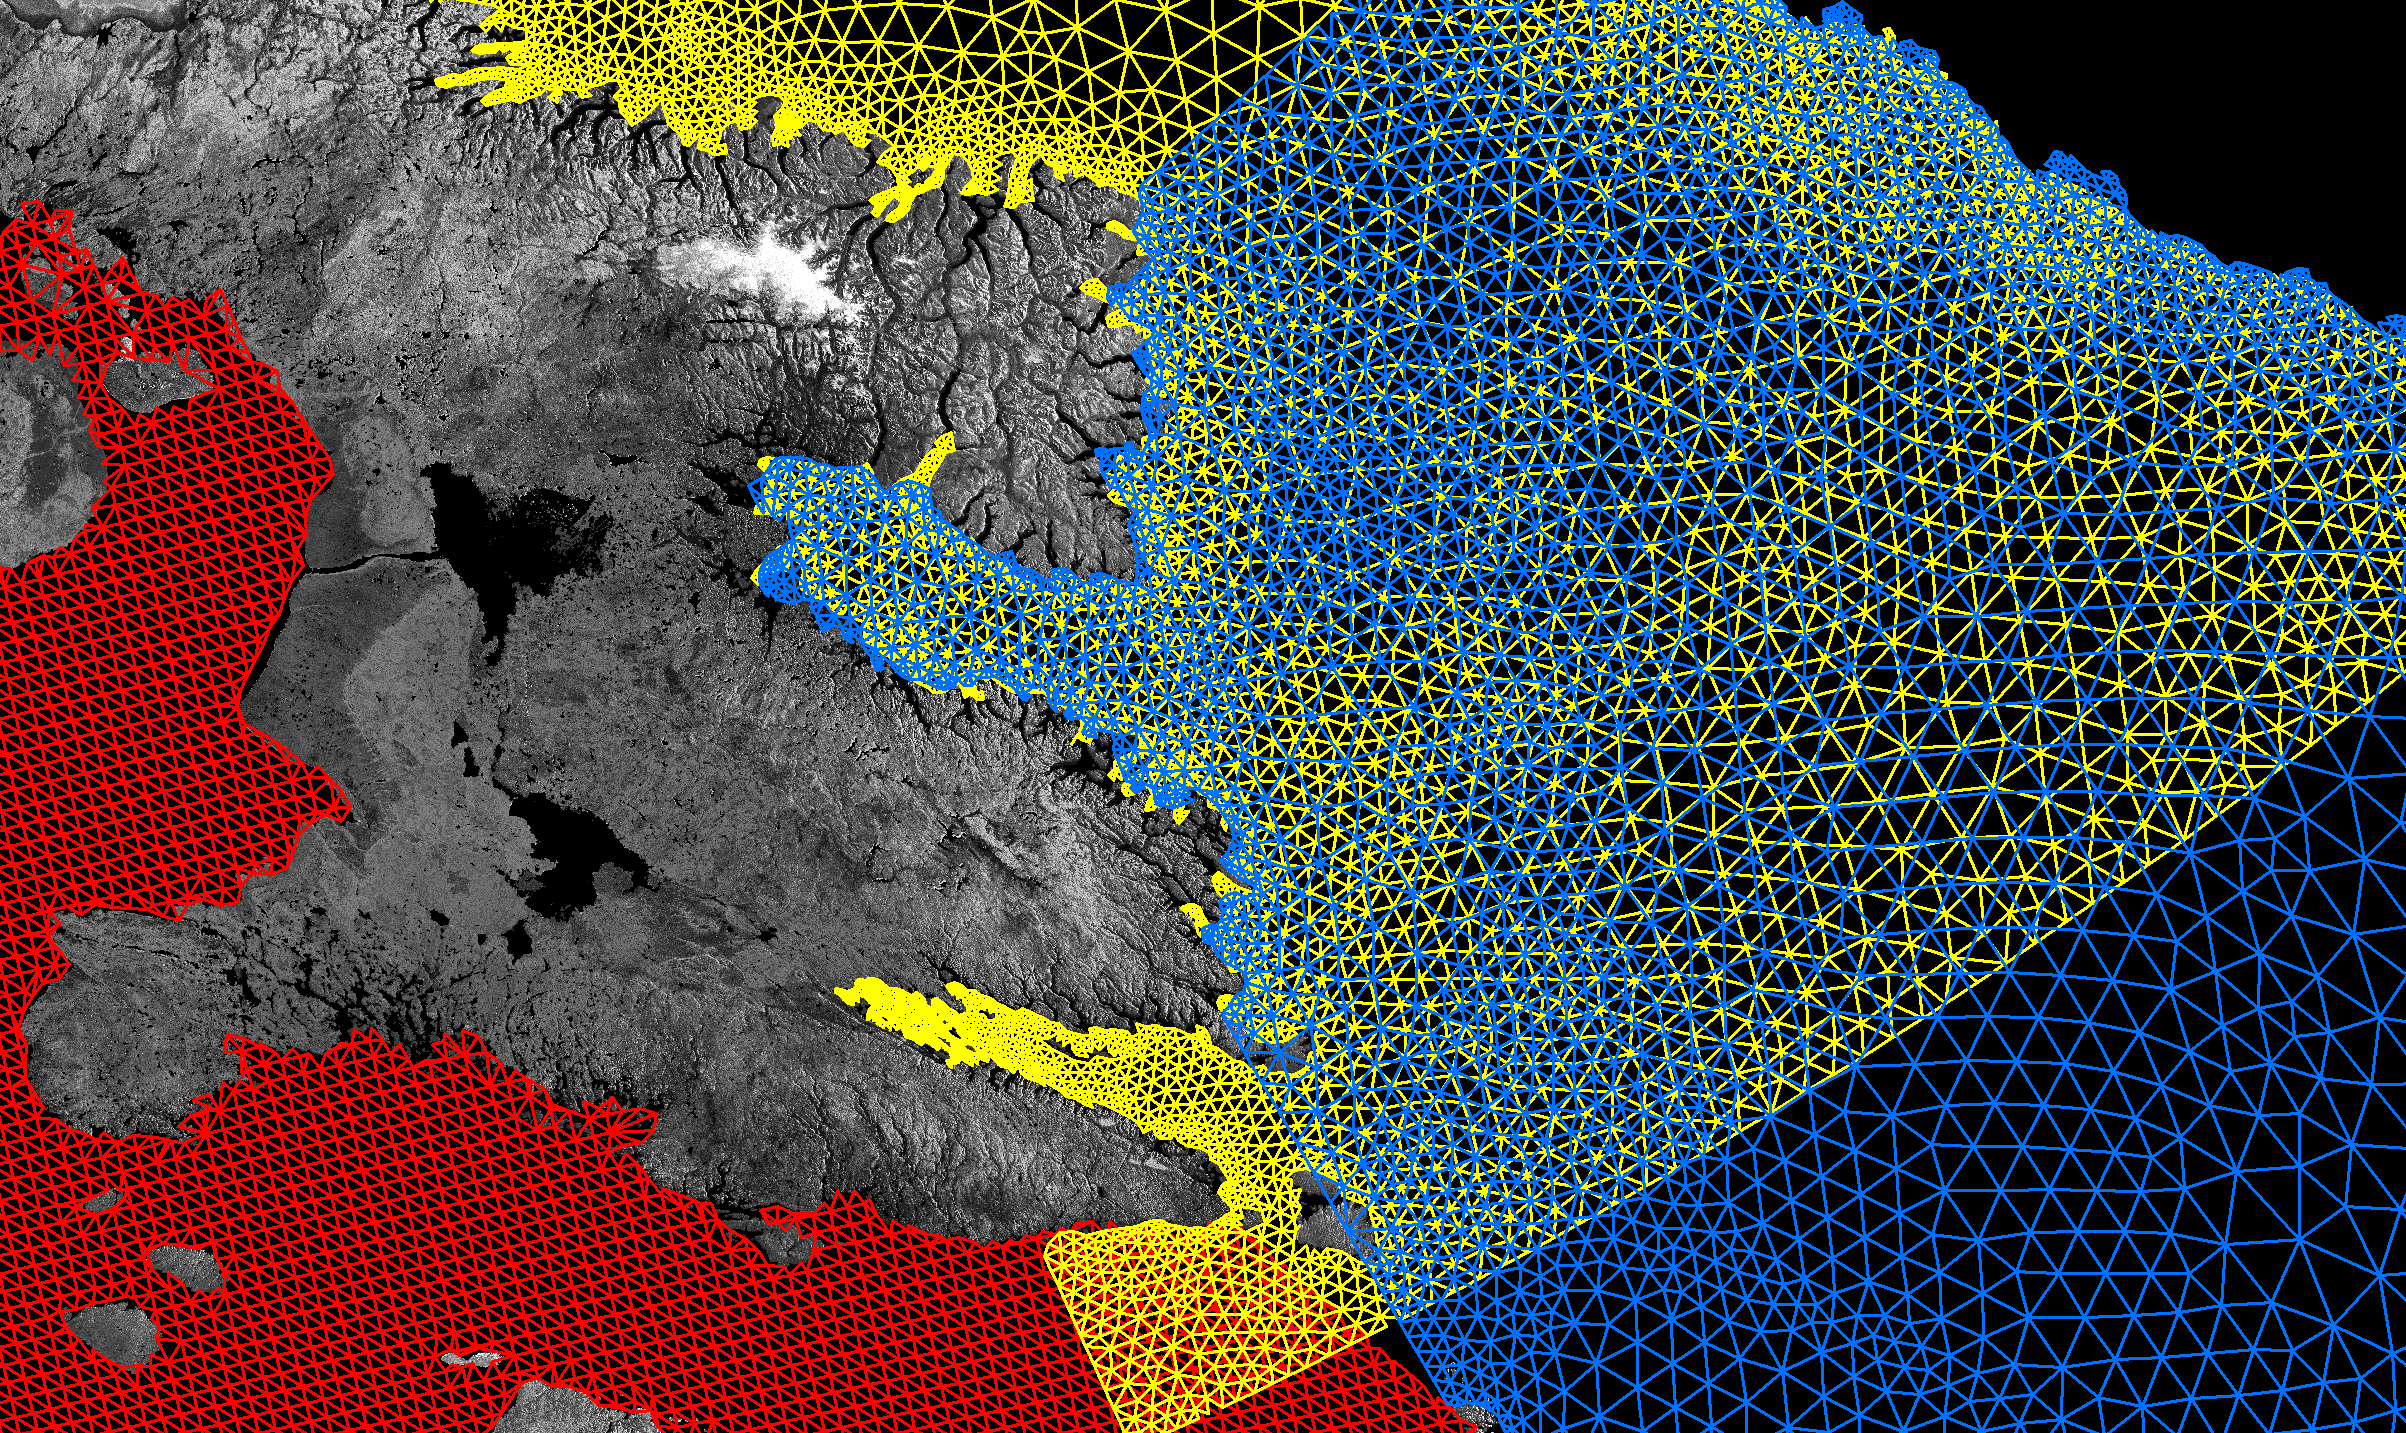
Arctic8 model coverage (blue)
NW Atlantic model (green)
Hudson Bay model (red)
Polygons defining default model
choice for ArcticNet surveys
prior to 2012


The newer Arctic9 model provides a first view of the likely variation in amplitude and phase of the tide along Frobisher Bay. The figures below illustrate the M2 constituent (by far the strongest contributor). As can be see, the amplitude of the tide increases up Frobisher Bay and the phase advances similarly up the bay indicating a rapidly progressing wave.

amplitude
phase
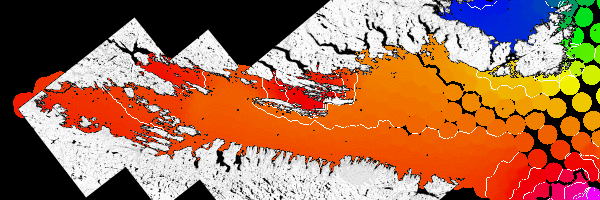
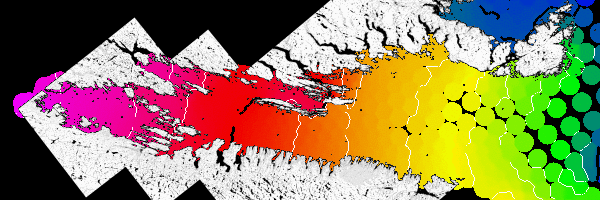
M2 amplitude - white line 0.1m contours, black line 1m contours. 
3.4m amplitude at head, 2.5m at mouth
M2 phase -range : -11 to -60 degrees (1 degree is roughly 2 minutes delay for an M2 tide)


page created by JEHC & JMuggah, November 2013