|
Please
note that this web page is currently under development
|
| Introduction: Located on the northern shore of the Bay of Fundy at the mouth of the Saint John River, The Port of Saint John is the largest seaport in the Province of New Brunswick, Canada. The port is essential to New Brunswick's petroleum, potash, forestry and aquaculture industries. In addition, it plays an important role in New Brunswick's import and export trade and, through increasing cruise business, contributes to tourism (http://www.sjport.com). The Saint John Port Authority manages the port and all shipping services, ferry services and cruise ships. In keeping with the Port Authority's mission, safe access to the shipping berths located in the port are maintained through regular dredging. As this constitutes a huge financial investment, the Port Authority has an interest in understanding the movement of sediments in the Saint John Harbour. The Saint John River is roughly 700km long and flows through the Provinces of New Brunswick and Quebec and the State of Main. It flows from its source in the Saint John Pond, Maine and discharges into the the Bay of Fundy at the city of Saint John, New Brunswick. The Saint John River provides approximately 60% of all the fresh water that drains into the the Gulf of Main and carries a seasonably varying load of suspended sediment. The Bay of Fundy is known for having the highest tides in the world with extreme tidal ranges of up to 16m. Tides in the Saint John River Estuary are damped by the Reversing Falls and have a range of about 50cm. The inner harbour is also characterized by a narrow constriction which results in strong currents. The combination of the above conditions result in a complex hydrodynamic regime that controls the level of sedimentation in the Port of Saint John. A multi-disciplinary study funded by the Saint John Port Authority and NSERC is underway at the University of New Brunswick and the Institut national de recherce scientifique to better understand the sedimentation, circulation and ecolorgy of the Saint John Harbour. The study has six objectives:
In order to meet the project's second objective, a hydrodynamic model of the harbour is being developed. The details of the modl are decribed below. |
| Model Domain: In order to properly model the circulation in the Saint John Harbour, it is important to include both the effects of the Saint John River discharging into the harbour and those of the Bay of Fundy with its large tidal amplitudes. To this end, the model has two open boundaries: one above the Reversing Falls in the Saint John River and the other from Sheldon Point to Black Point opening up into the Bay of Fundy. We have chosen to place the Saint John River open boundary at the sill just above the Reversing Falls. This choice was made for ease of boundary conditions implementation. In a baroclinic model, temperature and salinity at any open boundary must be specified. The depth at the sill is sufficiently shallow that any water flowing downstream over the sill into the model domain has vertically constant water properties (temperature and salinity). In addition, since it is surface river water that is flowing into the model domain, the water properties do not change throughout the tidal cycle. The Saint John River open boundary is quite narrow at approximately 150 meters wide whereas the Bay of Fundy open boundary is approximately 7 kilometers wide. |
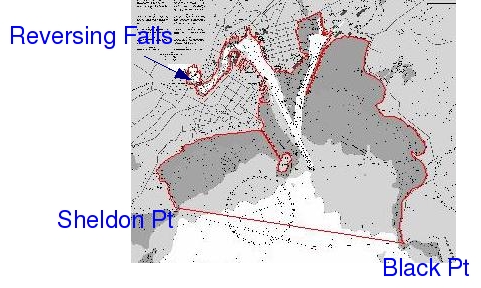 Figure 1: Model
boundary
|
| Observations: Modellers rely heavily on observational data in both the development and assessment of their models. For an estuarine model not only is bathymetric data required but conditions at the open boundary are crucial in order to properly predict the circulation in model's domain. OMG Surveys: One of the goals of objective 6 of the study focuses on providing a precise bathymetric model for use by the hydrodynamic model. At the start of the study, archived multibeam surveys of the harbour (1996, 2000, 2001, 2005) were examined and used as a reference for subsequent surveys. In April 2008, the most complete multibeam survey to date of the harbour was completed. This survey along with the previously archived surveyed were used in the creation of the bathymetric model used in the development of the hydrodynamic model. The multibeam study (data collection and analysis) is being conducted by OMG's graduate student Sven Commandeur. In addition to the developing a hydrodynamic model of the harbour, objective 2 includes a field study in order to better understand the estuarine circulation. The data was collected and is being analyzed by OMG's graduate student Reenu Toodesh. The field study was conducted at four different river level stages: winter minimum (26 March 2009), spring freshet (22 April 2008), summer minimum (11 June 2009) and fall freshet (14 November 2009). At each stage, UNB Ocean Mapping Group's ship, the CSL Heron, was used to collect oceangraphic data over an entire tidal cycle. Throughout the tidal cycle, the ship steamed continuously down the main channel, up into Courtenay Bay and back collecting temperature and sailinity using a Moving Vessel Profiler (MVP) and current and acoustic backstcatter using an ADCP. Additionaly the location of the halocline was observed using a 200kHz volume backscattering echosounder. The oceanographic study is important in the understanding of the estuarine circulation as it provides a view of the progression of the salt water layer throughout the tidal cycle at different river flow conditions. The data collected in the study is also important to producing a successful numerical model. The temperature and salinity data are used for both boundary conditions at the Saint John River open boundary as to initialize the model's temperature salinity fields in the main channel and Courtney Bay areas of the model. In addition, the current data is used for model comparison. |
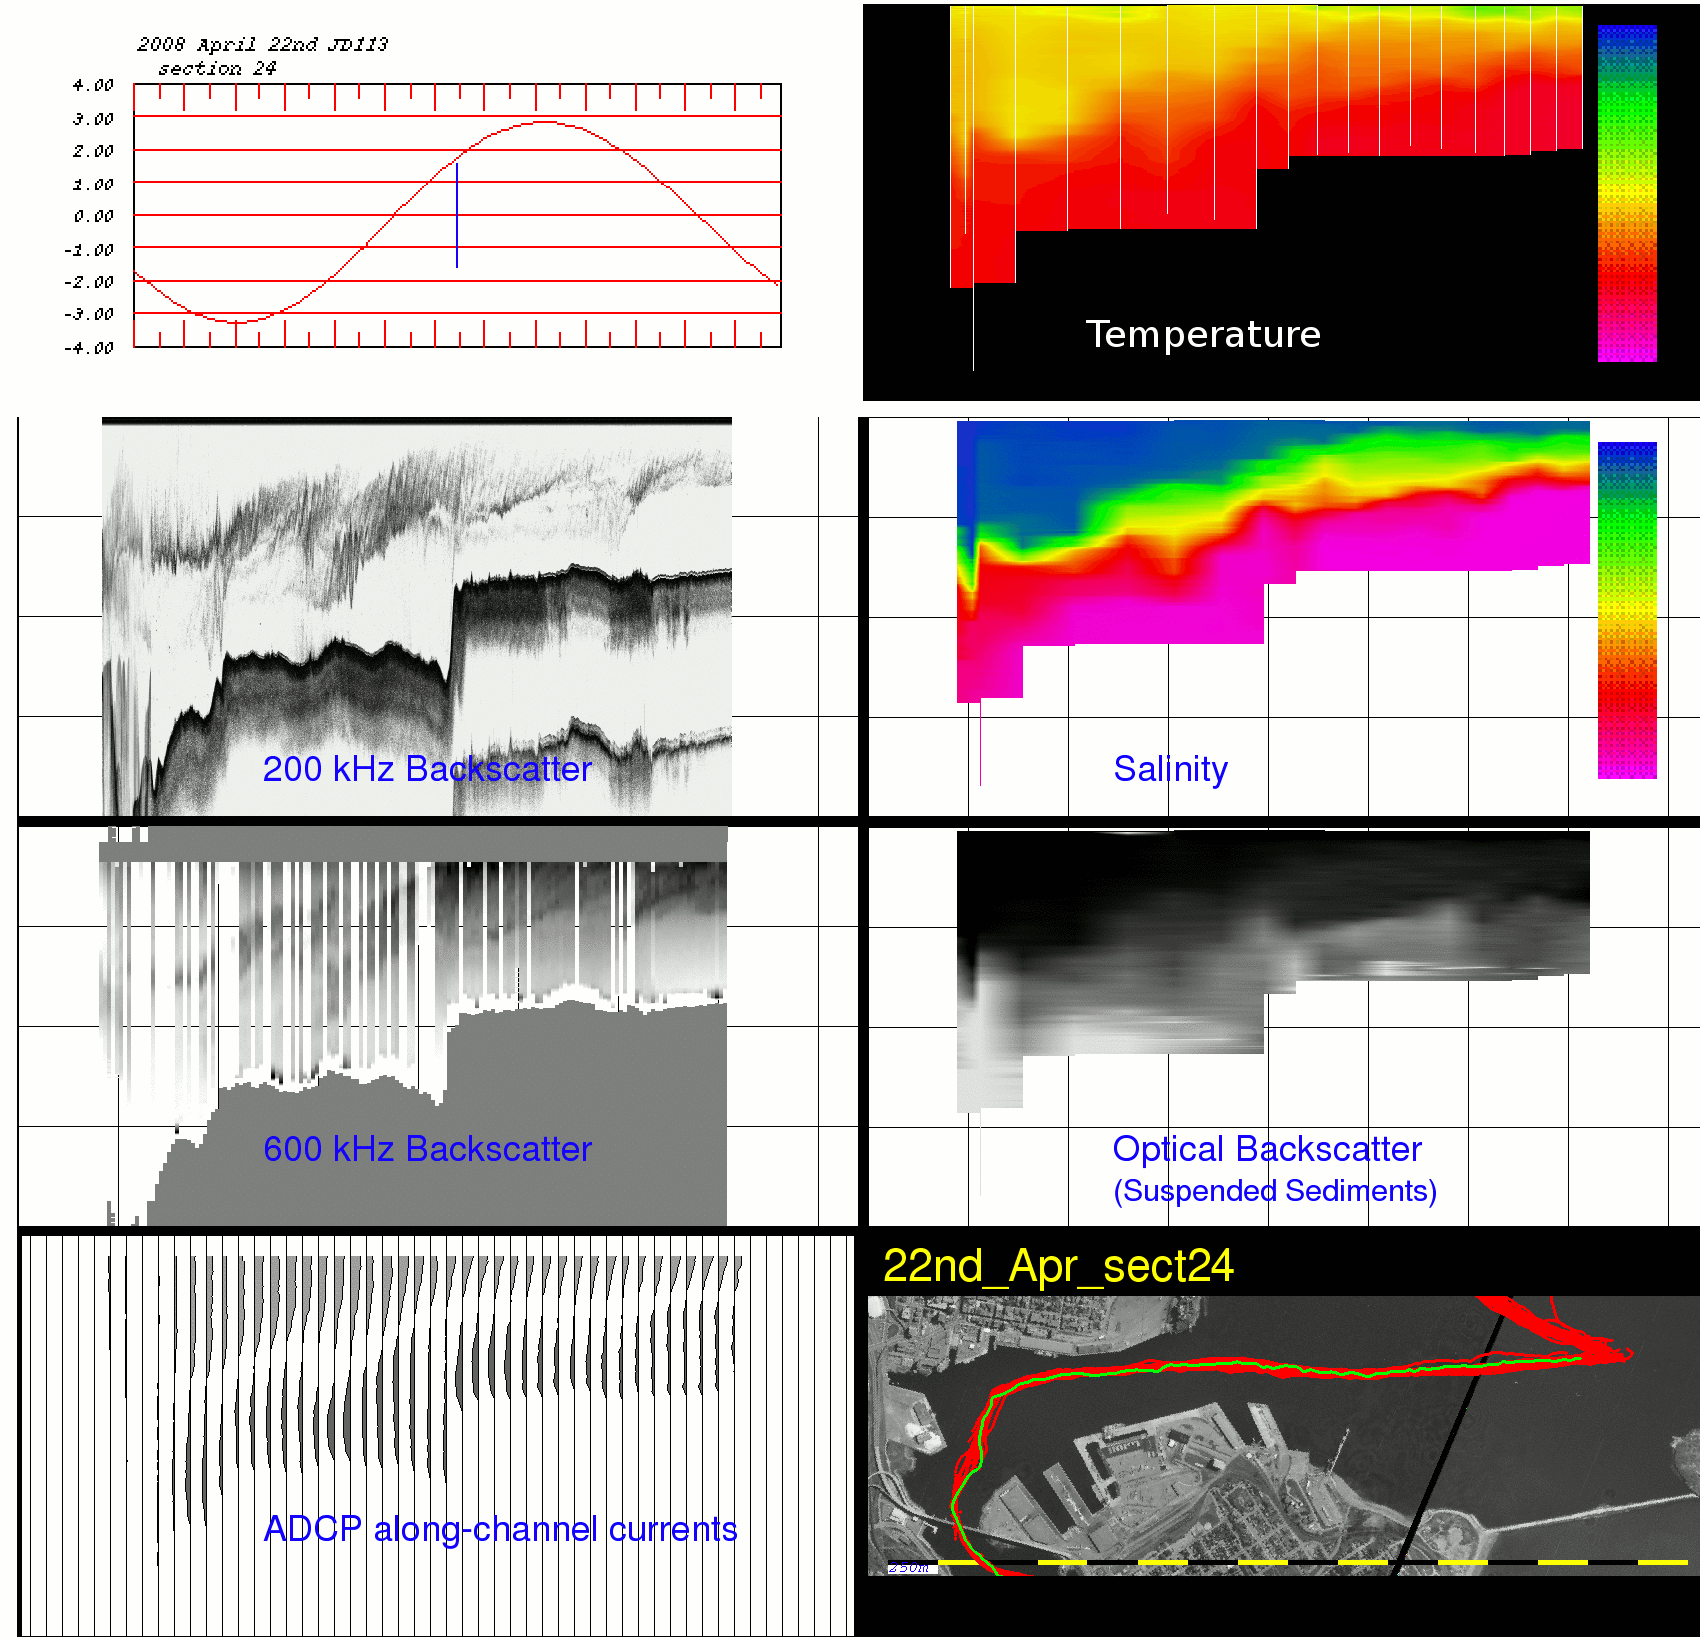 Figure 2: An example of the data collected during the survey on 22 April 2008. The section of the transit from the Reversing Falls into the Saint John Harbour is show. The shown transect occured during the flood tide. The ranges for the above temperature and salinity scales are 2.5 - 3.0 degrees C and 1 - 32 ppt, respectively. |
| In addition to the oceanographic
surveys conducted from the main channel of the Saint John River up into
Courtney Bay, OMG conducted an additional survey in the outer harbour
on 7 May 2008. The ship followed four transects radiating out
from Partridge Island into the Bay of Fundy. The same
oceangraphic data as described above was collected and is crucial for
the initial and boundary conditions of the baroclinic model. River Levels: Our model has two open boundaries. The first is just above the Reversing Falls in the St. John River while the second open boudary is in the Bay of Fundy an d spans between Sheldon Point and Black Point. Environment Canada's Water Survey of Canada is responsible for the collection of water resource data in Canada. We have obtained hourly river levels for 2008 at the Saint John River at Saint John (45°16'24.2" N, 66°05'20.0" W). These values are used to force the Saint John River open boundary. WebTide Model: The tidal prediction model WebTide was developed by the Department of Fisheries and Oceans Canada. WebTide provides a graphical user interface to a tidal prediction program. WebTide has several model domains from which the user can choose and will give tidal predictions for any point inside a selected domain. We use data from the Scotia - Fundy - Maine model domain (Dupont et al., 2005) to determine the elevation along the open boundary. |
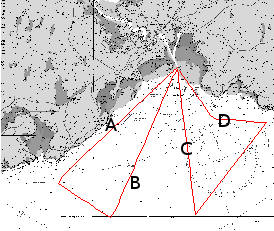 Figure 3: Positions of transects from 7 May 2008 oceanographic survey. |
| The
Numerical Model: The Finite Volume Coastal Ocean Model (FVCOM), developed by Chen et al. (2003) is a prognostic, finite-volume, free-surface, three-dimensional primitive equation ocean model. FVCOM uses an unstructured triangular grid in the horizontal. Models with unstructured grid are ideally suited for use in modelling estuarine flows as they permit resolution of fine details without requiring a high resolution grid throughout the entire domain, an advantage in the consideration of model run times and memory requirements. In the vertical, FVCOM uses a σ-coordinate system (also known as a terrain following coordinates) which gives a good representation of the bottom topography. FVCOM is forced by the following external forces: surface wind stress, heat flux, precipitation/evaporation, tides, river discharges and groundwater flux. For the purpose of this study, the effects of wind, heat, precipitation/evaporation and groundwater flux are neglected as the main driving forces of the harbour circulation are the discharge of the Saint John River and the tides in the Bay of Fundy. |
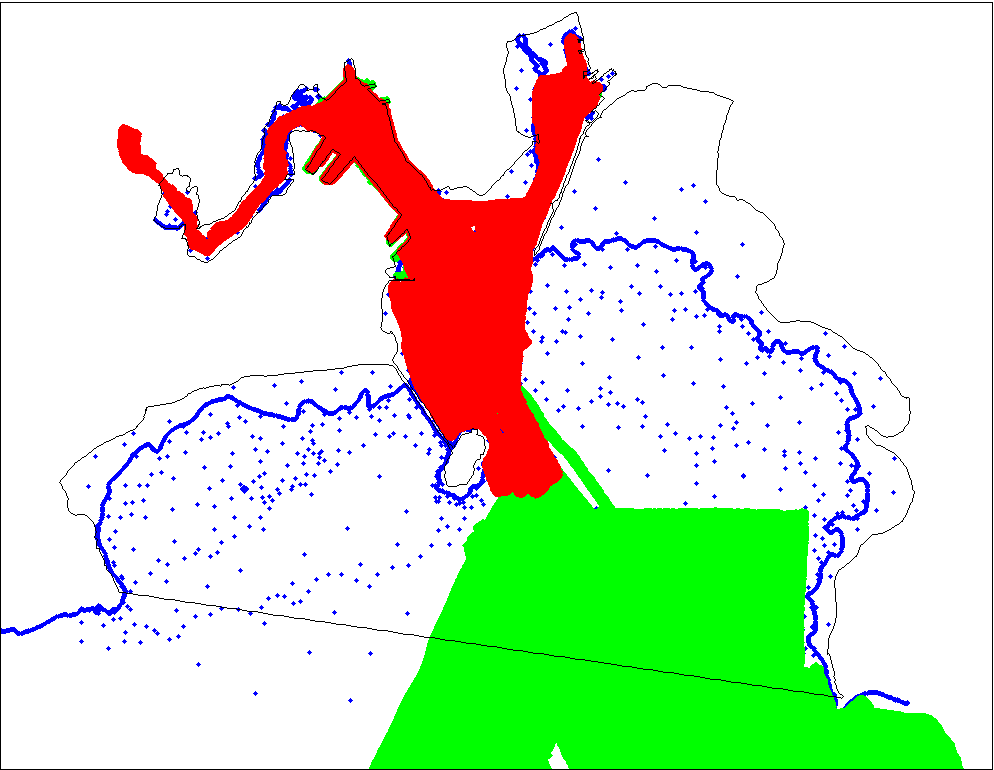 Figure 4: Coverage of bathymetric data: OMG 2008 multibeam survey (red), archived multibeam data (green), digitized data from CHS chart 4117 (blue). Model boundary is shown in black. |
Coastline and
Bathymetric Data: The coastline for the grid was obtained from a digitized version of CHS chart 4117. Three different data sets were used for the model's bathymetry. At one meter grid spacing, the 2008 multibeam survey conducted by OMG resolves even the smallest features of the port's topography. In addition, a compilation of previous multibeam surveys (1996, 2000, 2001, 2005) provides one meter coverage of areas not surveyed in 2008. For areas that were not included in any of the multibeam surveys (for example in the shallow areas east of the breakwater), data from CHS chart 4117 was used. The CHS chart data is a combination of the digital low water line and manual digitization of the 2, 5 and 10 meter contours as well as individual soundings. All data was reduced to a 4 meter grid for input into the grid generating program. |
Horizontal
Unstructured Triangular Grid: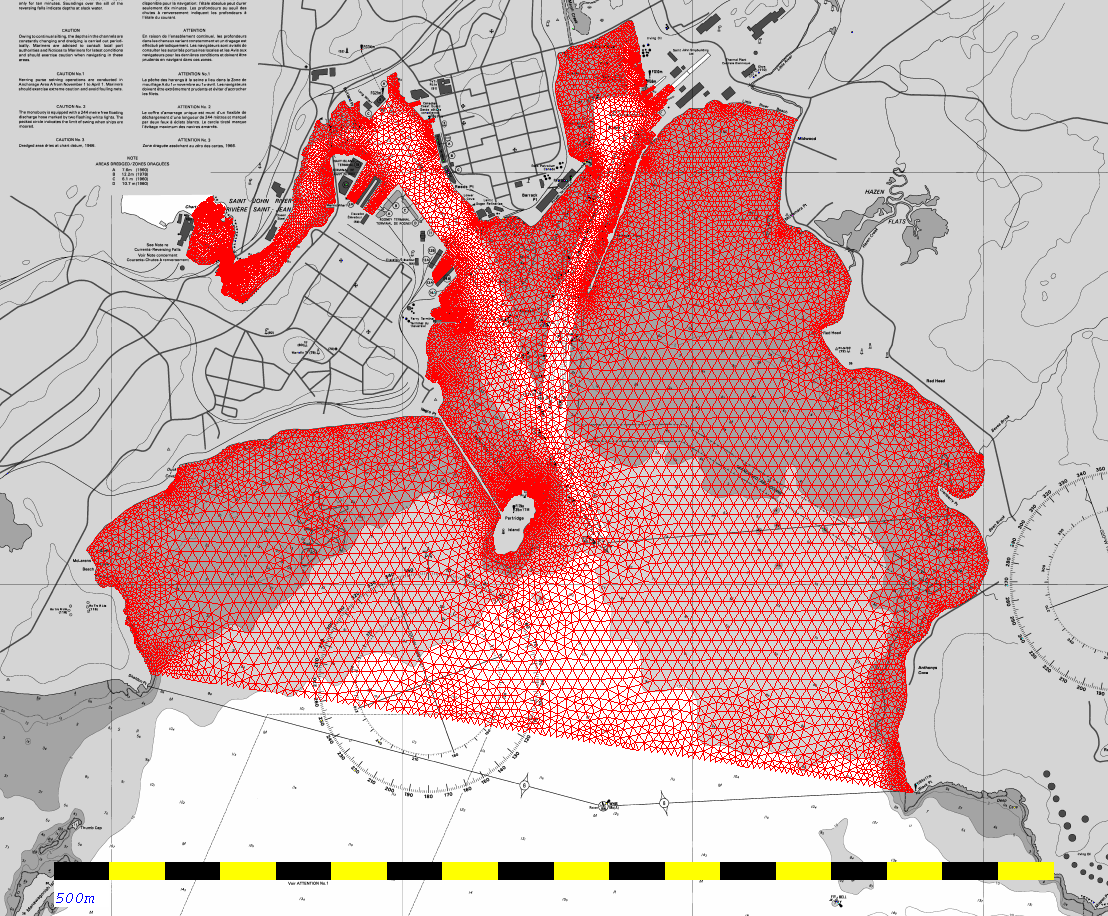 Figure 5: Model Grid
|
| A preliminary horizontal triangular
grid was created using resolute (Chaffee and Greenberg, 2003), a Perl
program that uses Triangle (Shewchuck, 1996) to generate
two-dimensional unstructured triangular grids for ocean
modelling. The mesh was subsequently refined using Genesis, a
package developed by Florent Lyard. The resulting horizontal mesh has
16471
nodes and 30679 triangular cells. Due to the unstructured nature
of the
horizontal grid, we
were able to resolve small scale features of the port such as shipping
berths resulting in triangular cells ranging in size from 4.4m2
to
6350m2. The bathymetry ranges from -4.4m to
44.2m. All depth are referenced to mean sea level and are
positive in the downward direction. A
negative depth indicates an area that is exposed ("dry") at low water. |
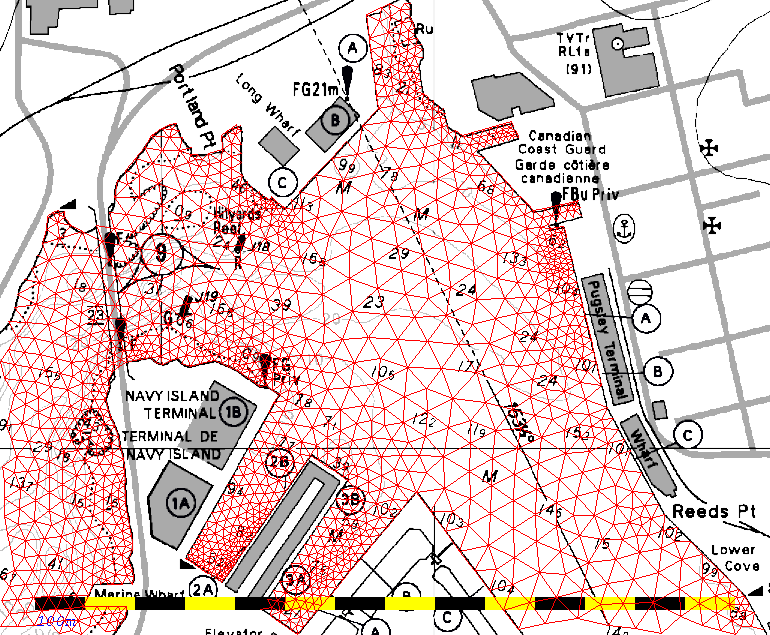 Figure 6: Enlargement of grid illustrating the resolution of fine details in the port |
| Model Runs: The eventual goal of this study, is to produce baroclinic model runs with conditions corresponding to the four oceanographic surveys conducted by the OMG on 22 April 2008, 14 November 2008, 26 March 2009 and 11 June 2009. The dates of these surveys were carefully selected in order to capture the various discharge regimes of the Saint John River, namely the winter minimum (26 March 2009), the sping freshet (22 April 2008), the summer minimum (11 June 2009) and the fall freshet (14 November 2008). |
 |
| Barotropic Runs: The final model runs will be three-dimensional baroclinic so that the circulation of the individual water masses (the fresh water from the Saint John River and the salt water from the Bay of Fundy) can be examined. Before running the model in the |
| Initial Temperature and Salinity: |
| Results: |
| References: Chaffey, J. D. and D. A. Greenberg, 2003. resolute: A Semi-Automated Finite Element Mesh Generation Routine. Canadian Technical Report of Hydrography and Ocean Sciences 225. Chen C. H. Liu, R. C. Beardsley, 2003. An unstructured, finite-volume, three-dimensional, primitive equation ocean model: application to coastal ocean and estuaries. J. Atm. & Oceanic Tech., 20, 159-186. Dupont, F., C. G. Hannah and D. Greenberg. 2005. Modelling the Sea Level in the Upper Bay of Fundy. Atmos.-Ocean. 43(1), 33-47.
Shewchuk, J. R., 1996. Triangle: Engineering a 2D Quality Mesh
Generator and Delaunay Triangulator. Applied Computational Geometry: Towards
Geometric Engineering. editors: M. C. Lin and D.
Manocha. Lecture Notes in Computer Science, 1148, 203-222.
Springer-Verlag, Berlin. |