Optical backscatter profiles
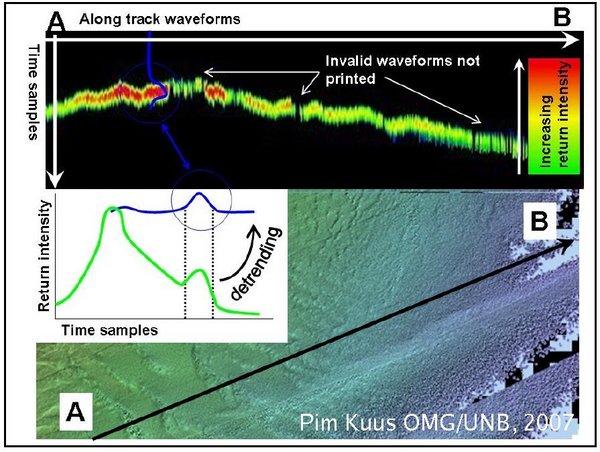
With make_Optech_prof longitudial profiles of the waveform intensities are made. The volume return is detrended, according to Ks, in order to stretch the color (or gray scale) display; thereby illustrating bottom return backscatter changes as well as possible. The user choose the waveforms (pmt/gapd/ir/raman), over a full survey line, or sections (defined by the a scan range). In addittion to the bottom pick solutions (start-, 50% leading edge, top-,or end of bottom return), markers per n scans can be added to the profile.
make_Optech_prof -pmt/gapd/ir/raman -out file_name merged_file
-nadir_beam: plots profiel of the centre beam of the scan
-bottom_pick: plots markers at surface return, strat of bottom return, 50% leading edge, start bottom return, top bottom return, end bottom return
-scan_range: plots profile between a given start and end scan number
-azimuth_agle: plots profile of beams at a certain azimuth angle
-area: plots profile only when in area, give an area file
-beam: plots profile of a given beam number
 |
Back
__________________________
Last modified: 2-9-08 Pim.
