Sidelobes, Amplitude and Phase detection
Pointing beams oblique bring some side effects that have to be accounted for. Sidelobes, multiples and noise can considerably contaminate the measurement. Sidelobe suppression and amplitude and phase detection are techniques to preserve a correct range measurement.
The appearance of side lobes and their effect to the bottom detection becomes evident with some animations in synSwath. The bottom detection tool in synSwath also helps to understand the reasoning behind amplitude and phase detection. The next few steps will explain the use of tools that visualize these phenomenons.
1) Bring up synSwath with a plate and open the necessary widgets:
synSwath -plate darley -level 1.0
from the apps, open :
a) Beam Pattern Control
b) Plate
c) Bottom Detection
d) Angular Response
2) Viewing the footprint on the seafloor:
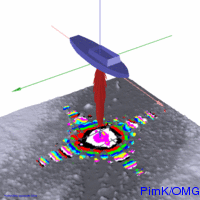
To view the illumination of the product beam (Tx x Rx) hit 'b' and 'i'. You can now clearly see the big patch illuminated by the main lobe. Other patches are due to the numerous sidelobes. Try changing the settings in the beam pattern control and observe what happens to the illuminated patches. You can also adjust the vertical exaggeration in the plate widget and see how shadows are casted due to the rough seafloor.
In the plate widget you can choose to view the intensity, time difference or phase difference of the beam. You'll have to refresh the screen after each change with the 'i' key. Go to Beam Pattern Control and point both tx an rx to nadir and view it as time difference. The angulars rings that have the same color correspond with the same time difference. The image nicely illustrates top of the main lobe as it hits the seafloor and it's remaining part and eventually the sidelobes that ensonify the seafloor. It will probably look something like this:
You can see that as the beam propagates the ring radiates and ensonifies other parts. Increase the vertical exaggeration and examine whether the first return is indeed from the main lobe.
For single beam echosounders or near nadir beams the first return will come from the mainlobe. However, when a beam is pointed oblique the first return may also be from a sidelobe. Although a sidelobe is considerably weaker it could be pointed near nadir and consequently have a much shorter range. Again go to the beam pattern widget and point the beam further from nadir.
More fun is to let the beam run over the swath. In the beam pattern widget place the mouse on either the Port_Stbd or Fore_Aft steering sliders and hit the left or right arrow keys. You'll see the beam making a complete swath.
You might also notice that the main lobe gets fatter as it is pointed further from nadir. Why? Beams are steerd by adding time or phase delays between neighbouring array elements. Acoustic waves from each array element interfere with each other, the resulting wave will therefore fade out or increase but ultimately move away from nadir. To preform beam steering it creates a
virtual array which in fact is shorter than the physical array. Recall that the beam angle is inverse proportional to the array length, therfore decreasing the array length permits the beam to get fatter.
3) Bottom detection
Take a look at the bottom detection window. The lower part of the bottom detection window represents the amplitudes of the returned signal. The middle part shows the phase differences and finally the upper part displays the zoomed data from either one of the lower parts.
Amplitude
The x-axis can be seen as the two way travel time (TWTT), the y-axis as the returned intensities. Amplitude detection is done with some kind of averaging filter on the peak (probably in combination with a threshold).
Phase
Again the x-axis is the TWTT, the y-axis runs from -180° to 180°. A phase detection algorithm detects a return from the main lobe at the zero-crossing of the phase difference.
Now compare the bottomdetection when the beam points near nadir and oblique. Near nadir you can clearly see a large peak, created by the mainlobe directly under the transducer. Ambiguously the large peak represents the bottom return at nadir. However the phase differences are less ambiguous, returns come from similar direction thus the discrepancies are less evident.
The amplitude envelope for a oblique beam is more stretched because the ensonified area has increased. Therefore it is less convenient to use a amplitude detection technique, for these cases phase detections is more feasible.
Examples:
Nadir
Oblique
Noise
To view the effect of noise go to the angular response widget and hit noise. You can also increase the level of noise by hitting '+' '-' while the mouse is positioned on the noise button. Note that, due to the TGV, the noise will increase the amplitudes with increasing TWTT. Try also the effect of the multiples and Rayleigh to the amplitudes and phase differences. Multiples seem to bias the phase detection, and the Rayleigh biases both. Makes any sense
.....?
Angular response
Examine what happends to your signal when it ensonifies varying sediment. The angular response widget shows the
angular response curve, beam angles on x, backscatter (dB) on y.
Imitate
different seabeds and view the ensonification and bottom detection.
Examples:
Hard bottom
Soft bottom
Objects
The resolution is controlled by the beamwidth. You can test the effect of varying beam dimensions by loading up a plate with aligning objects. Follow this
link to learn more about creating a plate with features. Compare for example a narrow beam of a multibeam system and that of a single beam echosounder.
View the appearance of sidelobes near the quay side:
last modified: 23-07-06, Pim.
