Usage of CHS single beam soundings
 for Cumberland Sound Operations

John HC and Ian Church

sound
Hi Travis,

Ian converted the ntx files from CHS into usable values and I've now edited out the non-sounding fluff. 

At this link :                     chs_cumberland_soundings.tar.gz
                                   (do not! pass this data on to anyone except other UNB as per DULA)

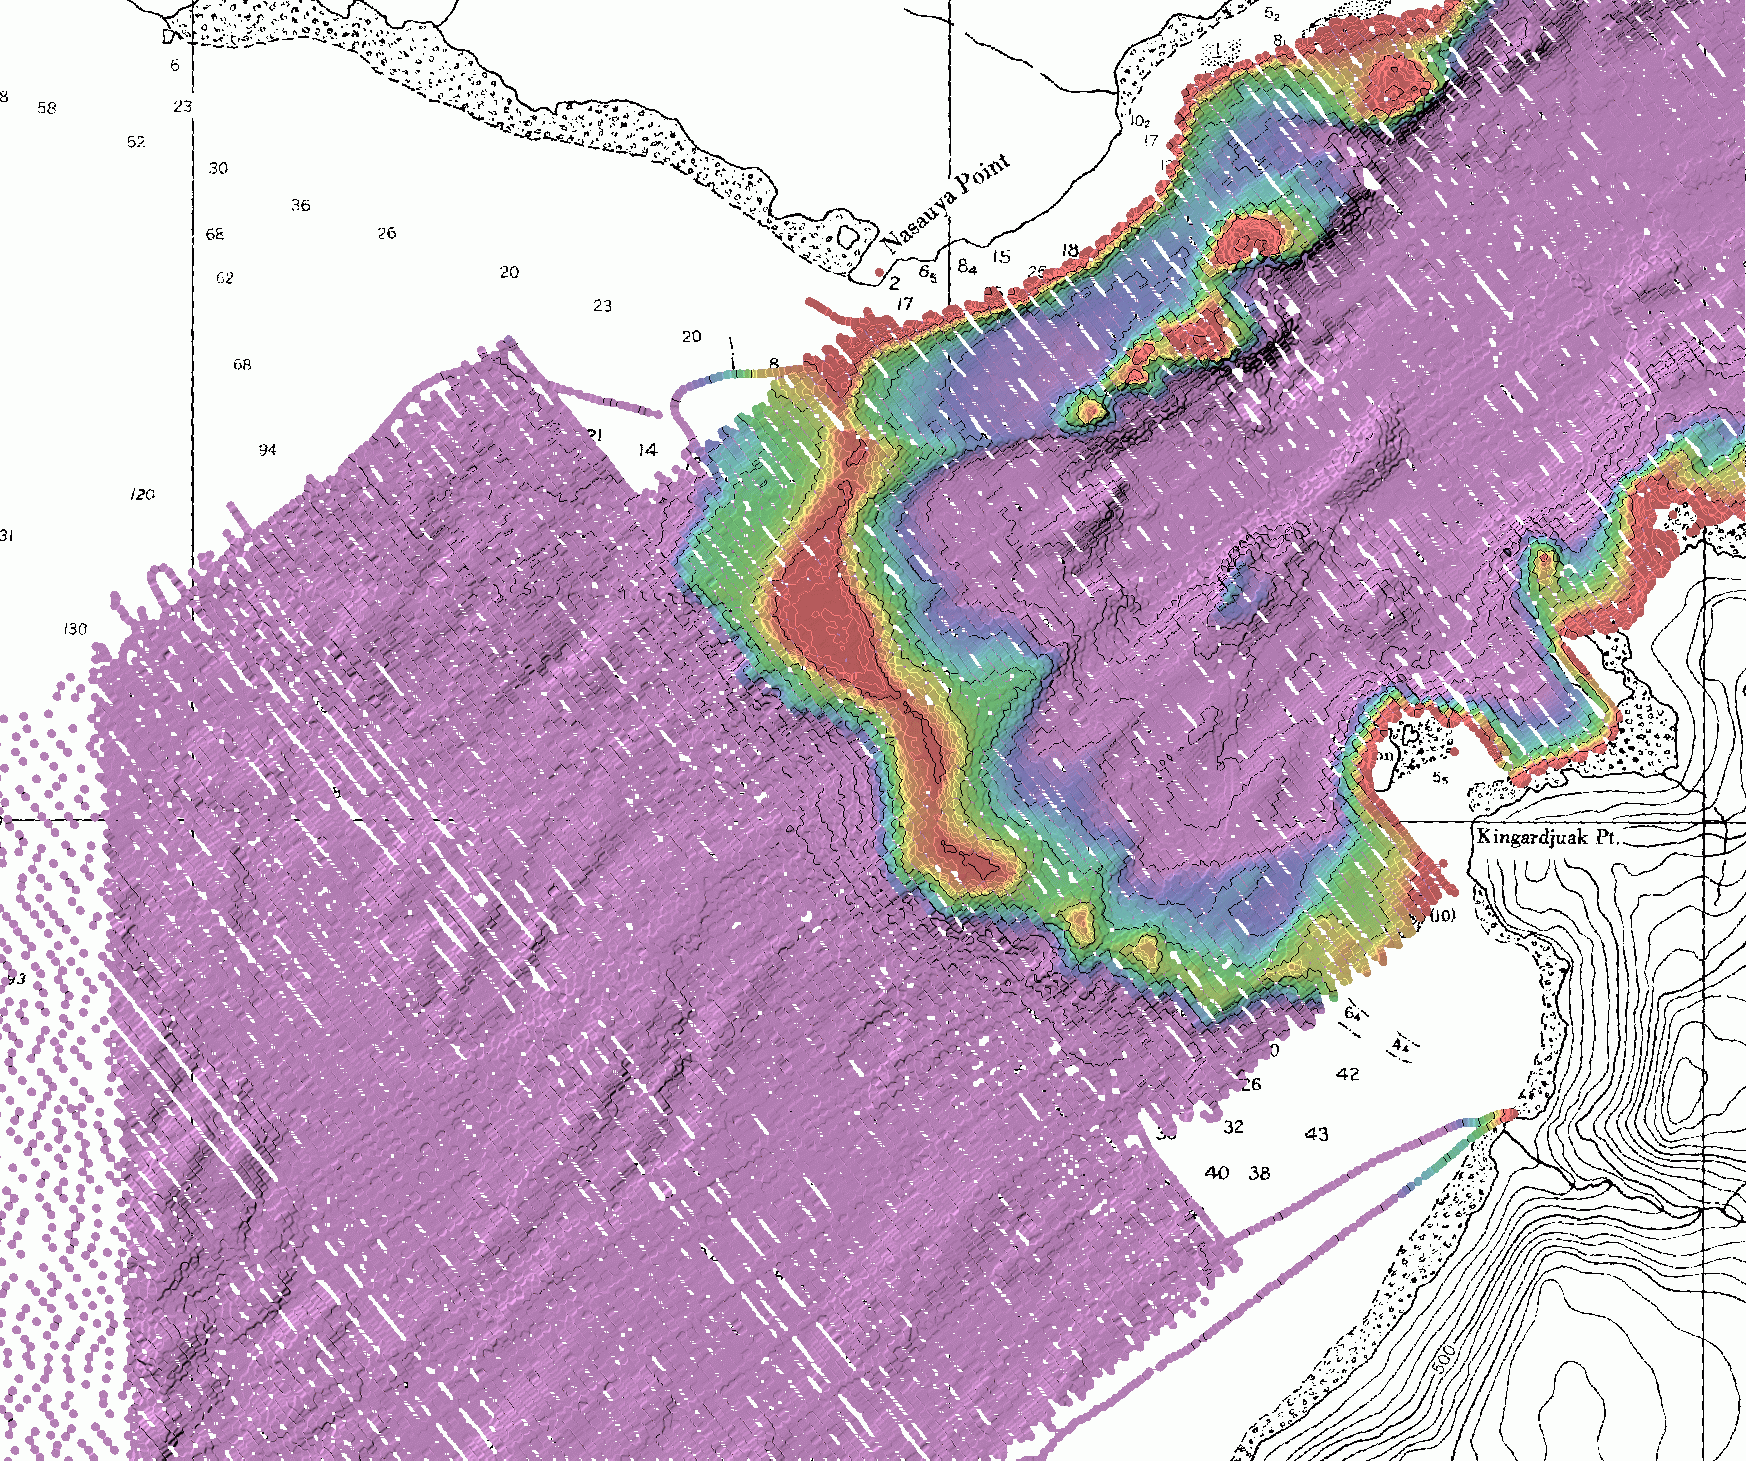
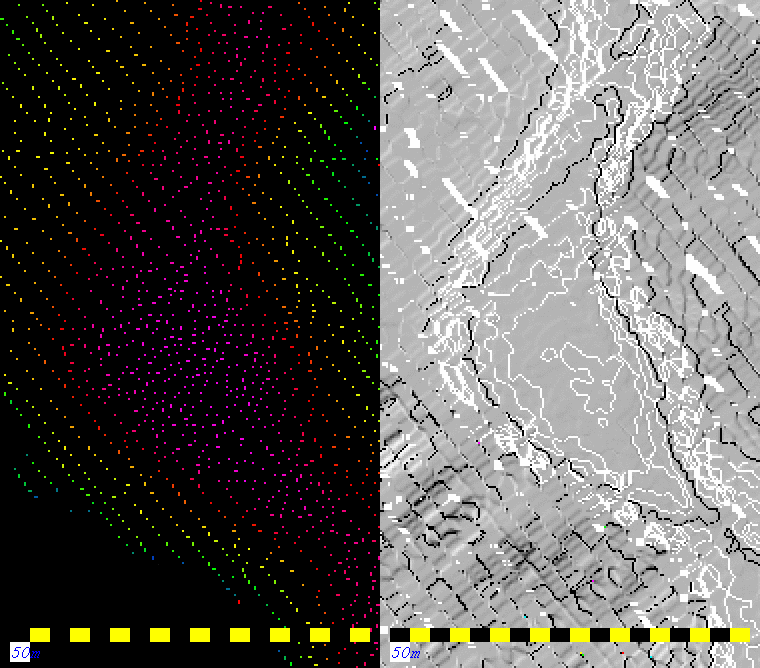
is the data in the standard OMG ascii "lat lon depth" format (decimal lat and long, negative depths are underwater - includes intertidal surveys). You can grid these directly :
                                            > weigh_grid -ascii. 

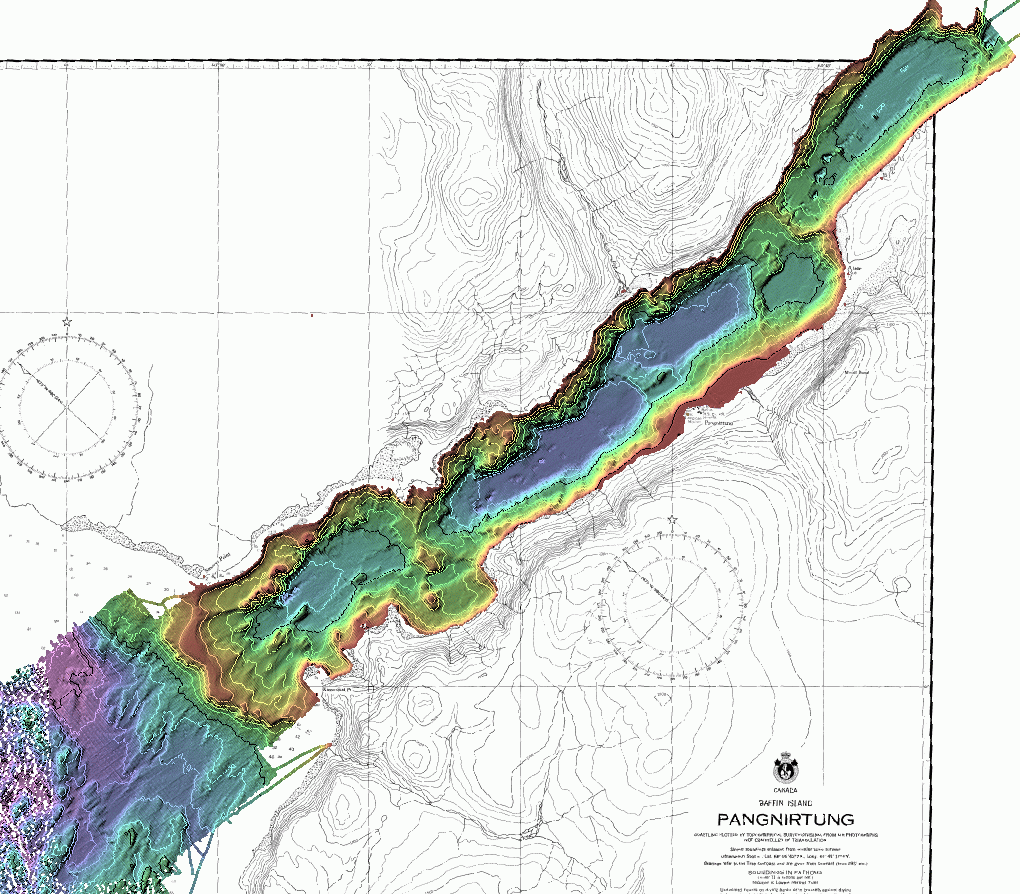
The Pang data is supposed to already be converted to NAD83. I can confirm that the Pangnirtung data exactly lines up with the Amundsen EM300 2007 data (to the limit of the single beam line spacing). The Cape Mercy data was NAD27 which we've tried to shift, but there may be an issue.

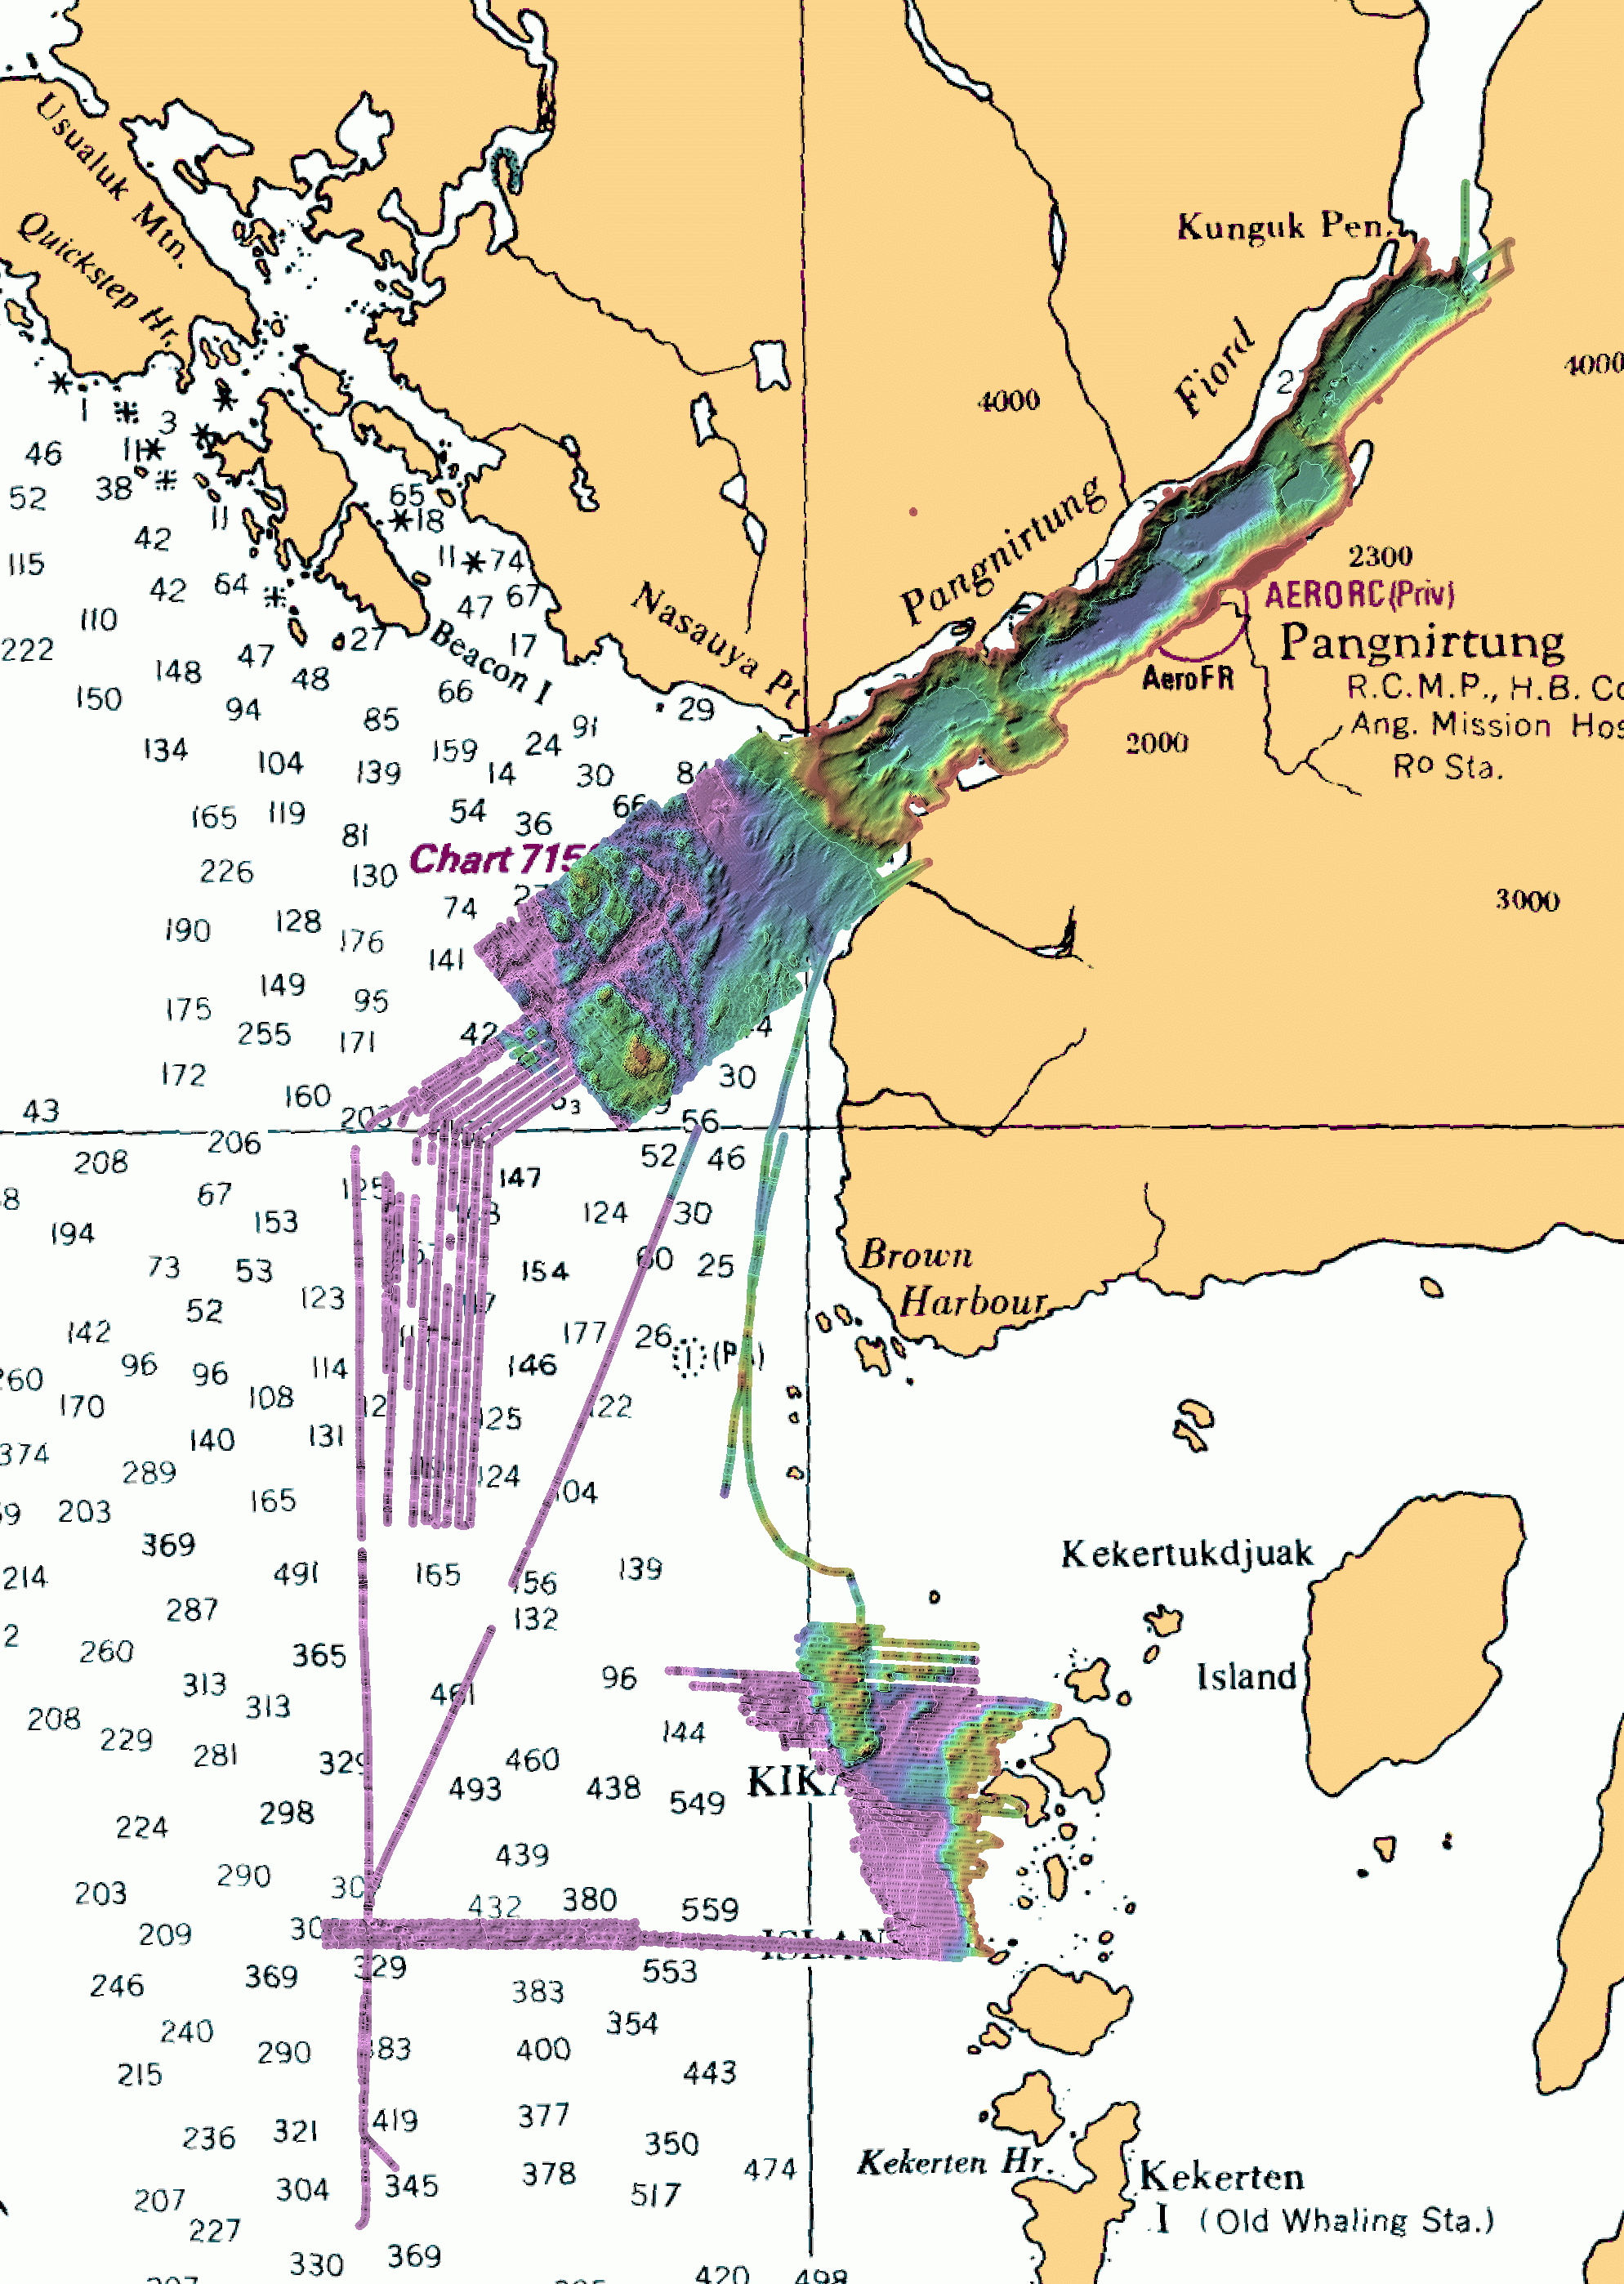
 The only charts of the area are CHS "unofficial BSB" scans of questionable datum charts. None of the ones that cover the area are in the official Digital Ocean Release (i.e. approved for release for ENCs so don't trust them other than relative), but we have those unofficial ones. I've converted them using the NOAA BSB reprojector.
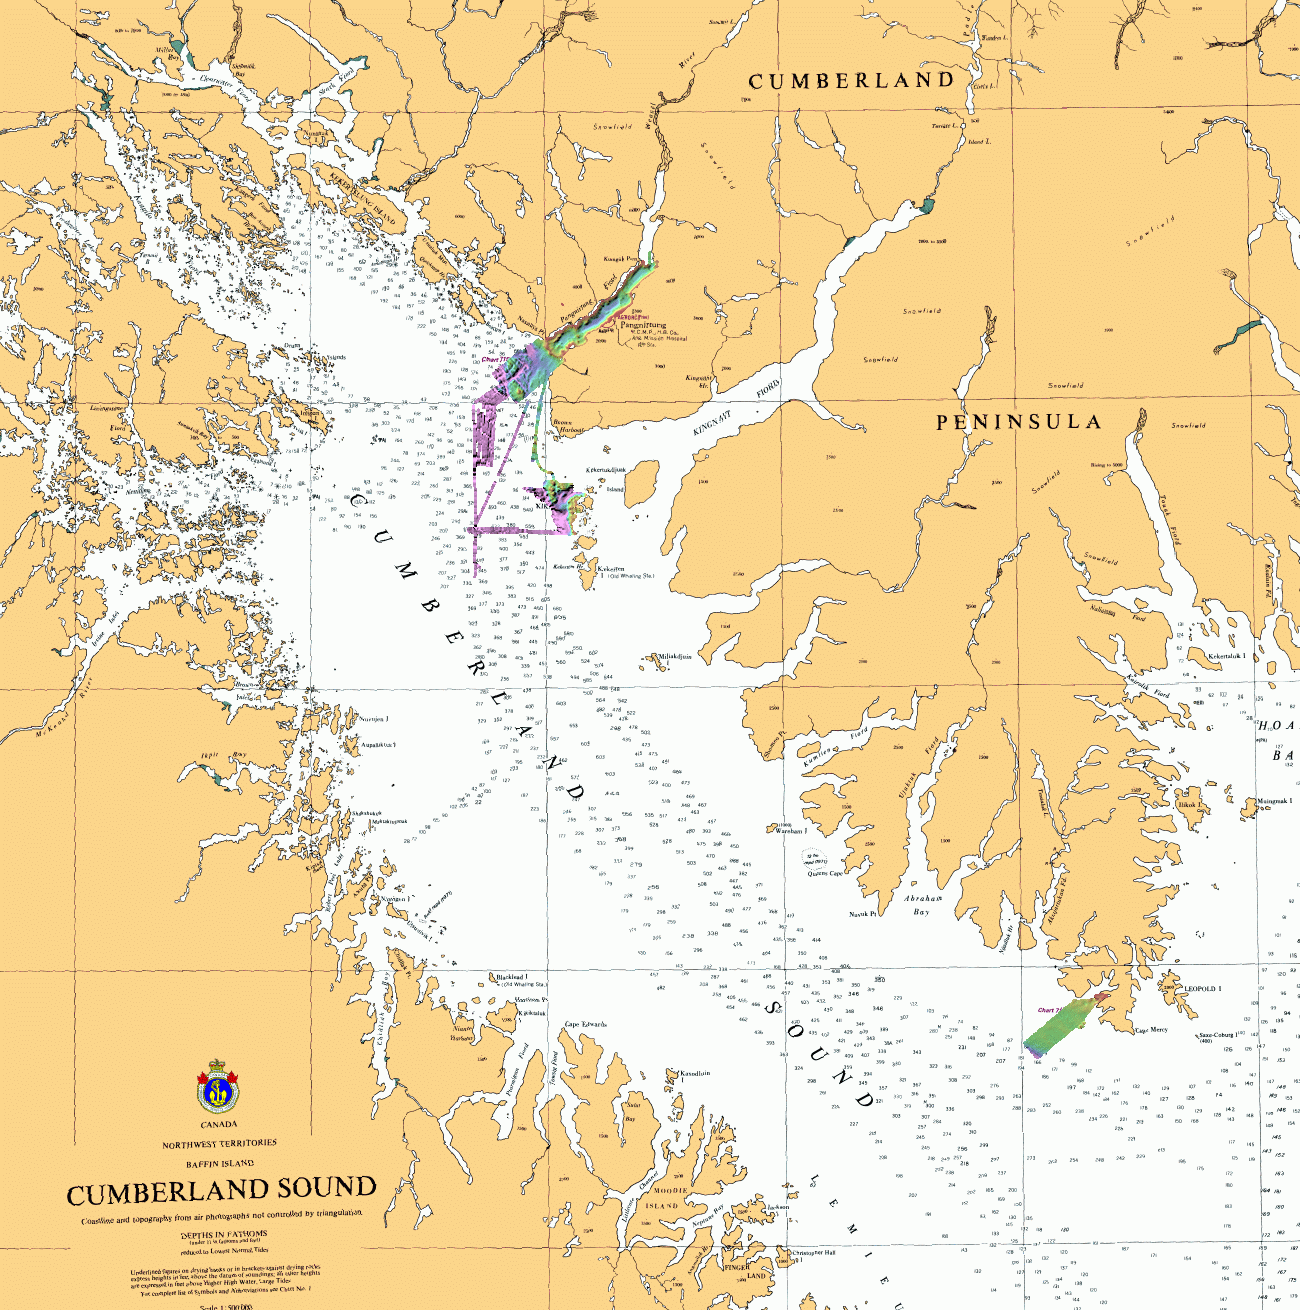
  • 7051 - Cumberland Sound - is way off...
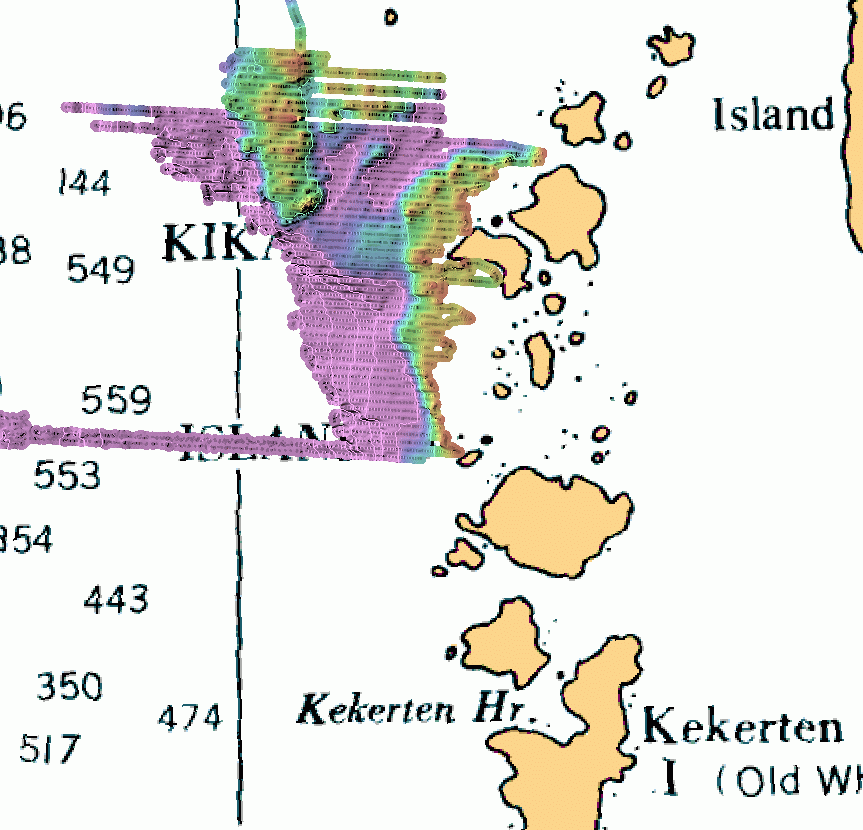
  • 7150 -  Pangnirtung Fjord - is actually almost dead on.
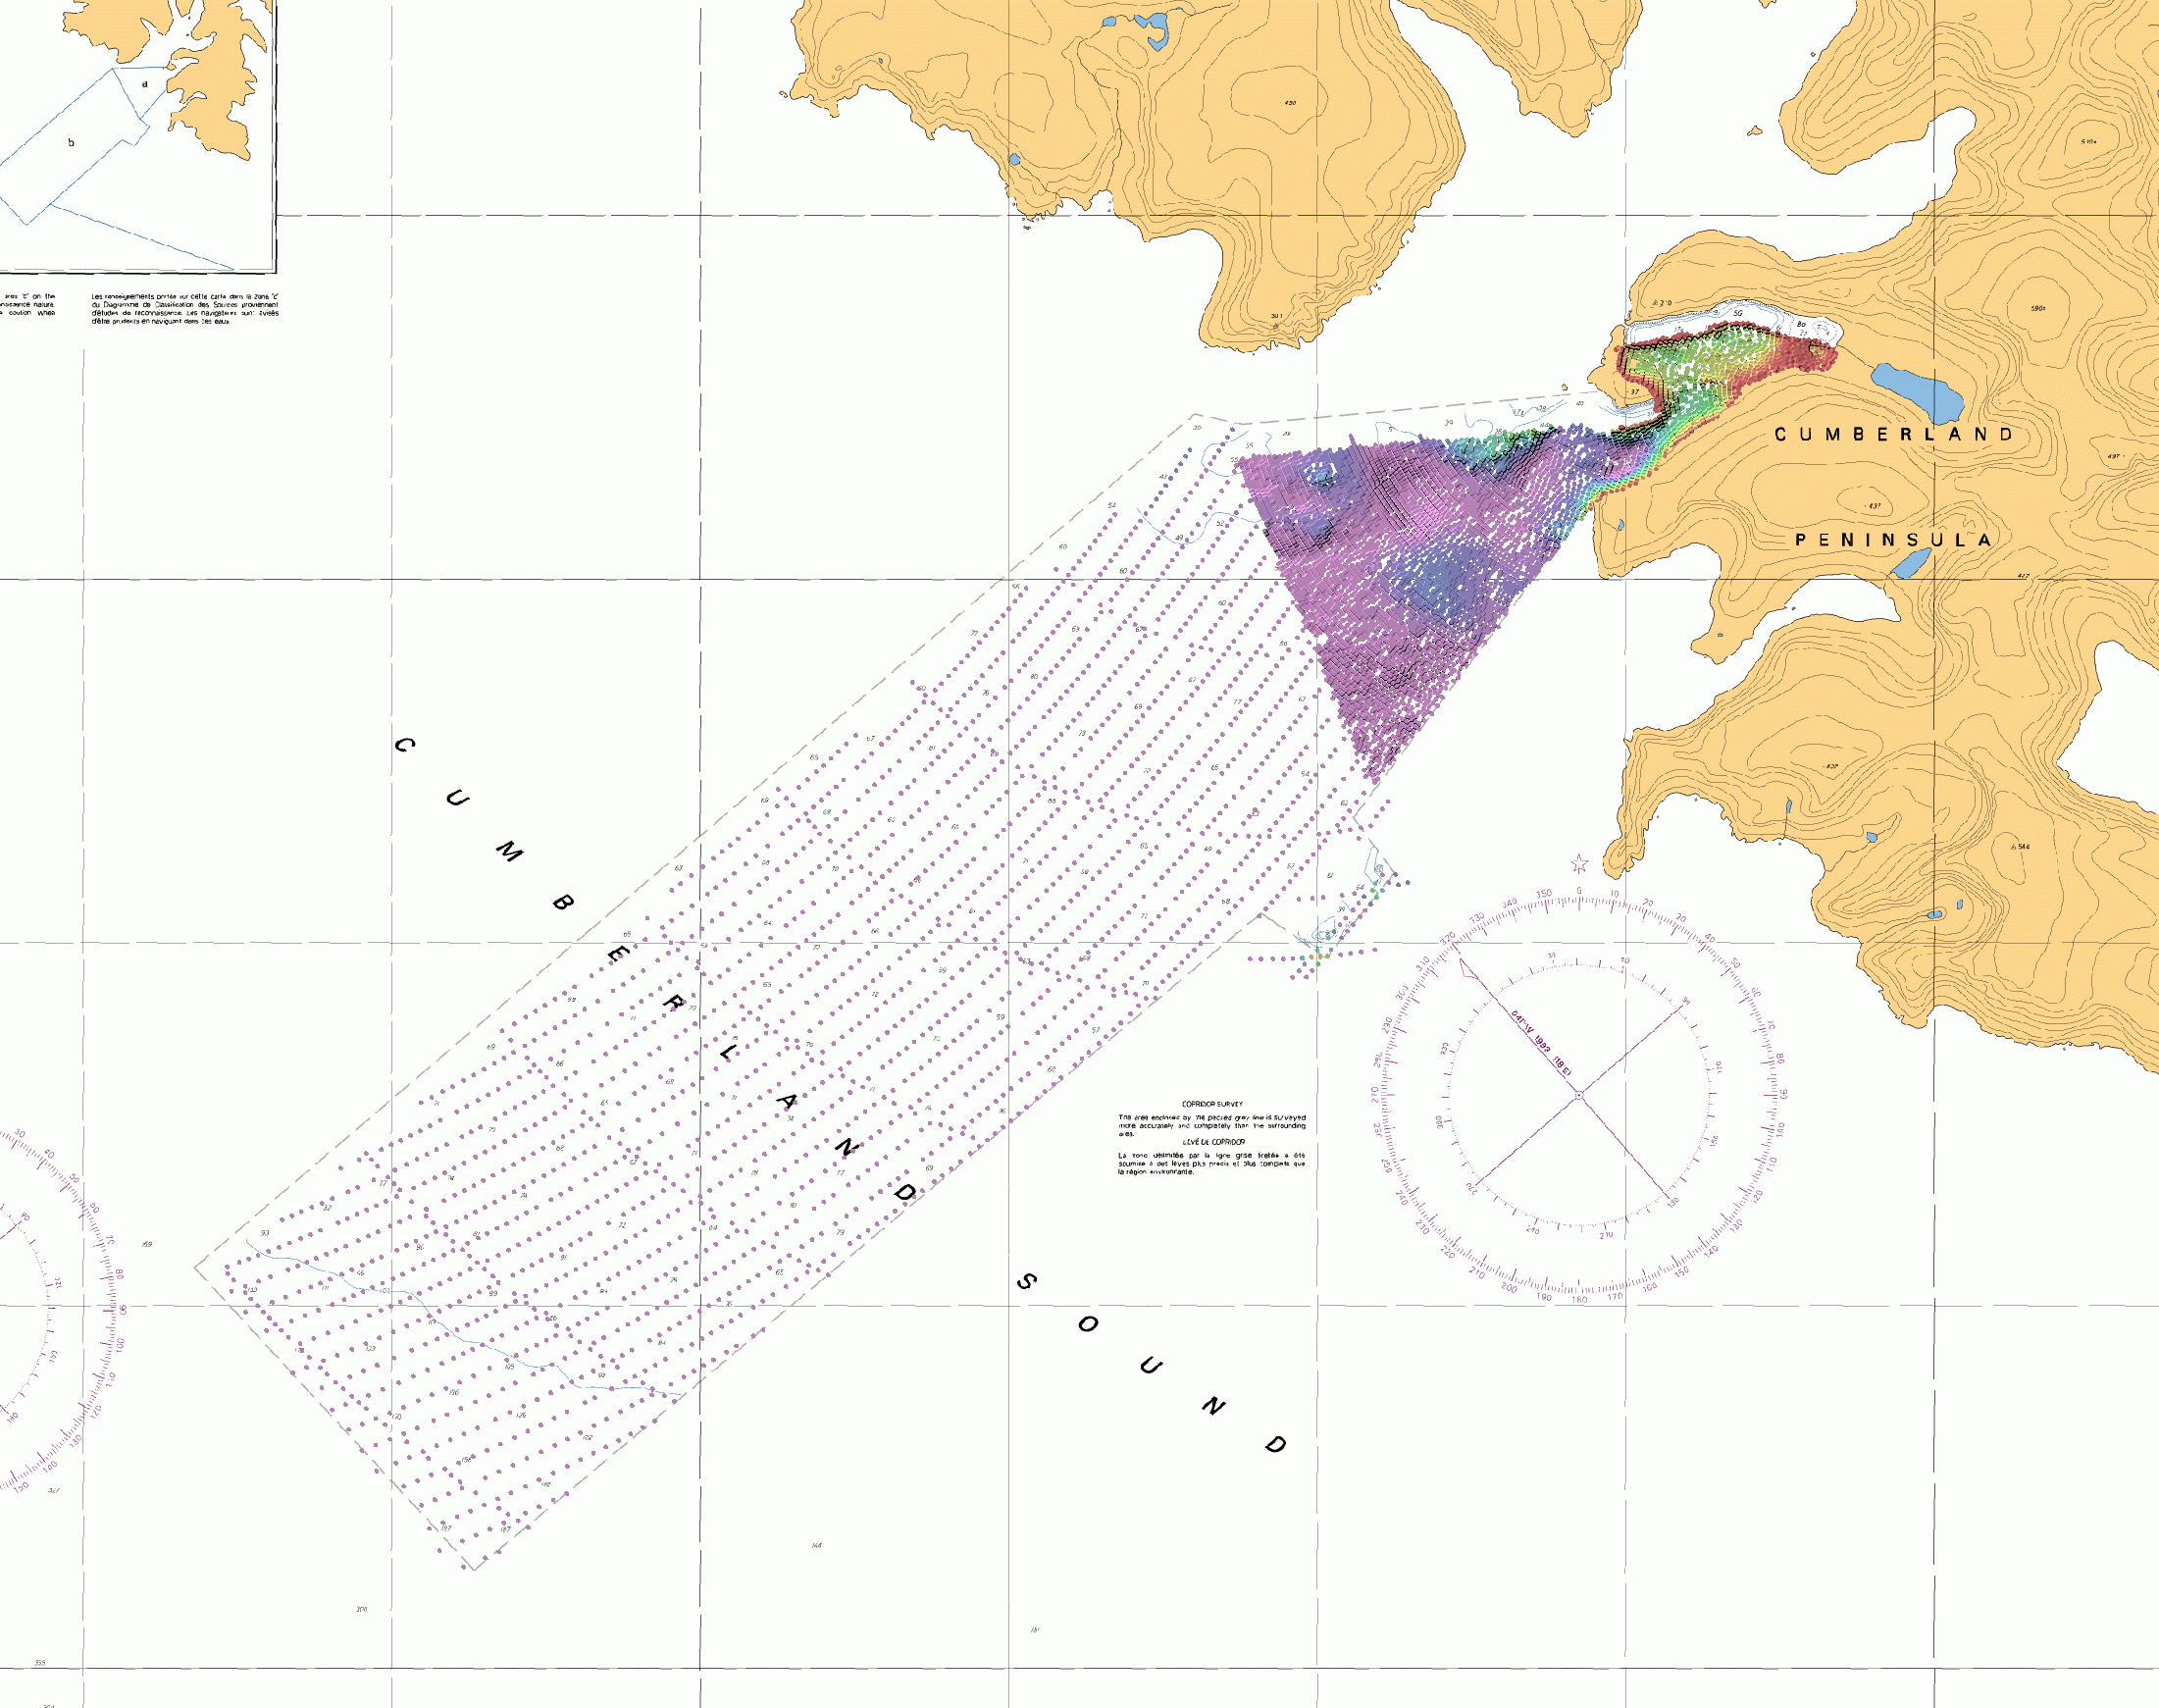
  • 7136 - Cape Mercy - does not agree with Ian's NAD27-NAD83 conversion. Don't know which to trust.


pang fjord
Inner Sound data

They include the coverage of the outer Pangirtung fjord and the constraining sill and drop off to seaward . As well they've included a coastal survey just north of Kekerton. and also they include the source soundings for the Cape Mercy anchorage.

As you can see, there is no official data in any of the areas that Kevin Hedges would like you to go:
  • Kingnait Fjord
  • Clearwater Fjord
  • Shark Fjord.
To try loading this in Aldebaran, a tif and a txt file is provided for MRE conversion:
it is the same area as the figure to the left, but with no chart background. I'd be curious to see how this projects. I've interpolated the coverage to get line-to-line continuity. It does mean that the edge of the intertidal zone goes on for another ~ 100m though.

fjord
Pangirtung Fjord Data

As you can see, most of the fjord has been adequately mapped at 50m line spacing.  It seems a bit of a shame that this zone is the prime target area. I will confirm with Trevor and Don as to exactly what their survey objectives are.
The figure has 100m contours in black and 20m contours in white. As you can see, nowhere in the fjord is 200m so all within EM3002 range.

I know they are looking for close to the beach off Pang. But as you can see it is very steep up to the intertidal zone (the single beam goes well up above that in the Pang immediate vicinity). The black line off the town is the 0m (CD) line.

They are also looking to cover much of the sill at the mouth of the fjord because apparently there was an active dragger fishery that is not finished. As explained below, unless there is a very very good scientific rationale, I can see no reason to cover the shallowest part of the sill.


pang sill
Details on the Sill

I've made a 5m pixel size image of the CHS coverage over the sill at the mouth of Pang fjord (to right). The point to note is the shoallest depths. On the amin sill top there is a 5.4 and a 5.7m (over  CD) in the CHS single beam file. The shallowest black contour that you see here is the 10m one. Black contours are at 10m interval, white ones are at 1m interval to 20m. The shallowest contour on the sill is a 6m one.  I've coloured it pure red shallower than 10m.

At this point, DO NOT go inside the 10m contour in the area where the 5.4 and 5.7m soundings are. If you look at the figure ot the lower left. you will see that the actual single beam sounding density over the shlao top (defined in the contour map). These are soundings in field sheet (exludes along track density), but still there are significant (50m+) wide  gaps in which a large glacial erratic boulder could easily be sitting. 

For the two <10m extensions to the south of the main sill top, the minimum depths are 9.2 and 9.3m so you can cross those.

See the annoted figure below.  Obviously do not go anywhere near the bedrock (0.2m or less) to the NE of the sill. You can see the track that the Amundsen took going in and out in 2007.
 
Again, I'm providing a tif and txt file for MRE conversion:

density
showing actual sounding density
shoals


Kekerton
Kekerton Data

As you can see there is a preliminary (~ 200m line spacing) survey to the north of the Whaling Station target.  This, together with a single transit line down from the mouth of Pang. Fjord, should allow you build up towards this GN target.

note that the 200m contour is well inshore. The white contours are at 100m intervals and the colours go solid at 200m depth.

It looks like you should be able to turn east, north of the islands to enter Kingnait fjord and do a transit in as far as Kevin Hedges would like to go. Hopefully within EM3002 depth ranges.


cape mercy
Cape Mercy Data

The line spacing here is much sparser so I've interpolated so you can see the coverage.

I've checked the graticules on the BSB and I'm pretty sure that it is good. Thus I think the NAD27-NAD83 conversion is suspect.

But there should be a vector ENC for this on the bridge and so it shouldn't matter. It is not a science survey focus. If you happen to be going there (Cecil may want an anchorage that he can trust), try to do transits in and out outside the approach corridor if he is o.k. with that.

The approach corridor starts in 200m water depth, about where the EM3002 should lock on.


made by JHC - July 25th 2012