 |
West Coast Multibeam Base Map Series
a proposal John Hughes Clarke (1), Kashka
Iwanowska (2), Mike Brissette (3) and Doug Cartwright (3)
|
|
West Coast Multibeam Base Map Series
a proposal John Hughes Clarke (1), Kashka
Iwanowska (2), Mike Brissette (3) and Doug Cartwright (3)
|
| 20m
pixel - > 1500m |
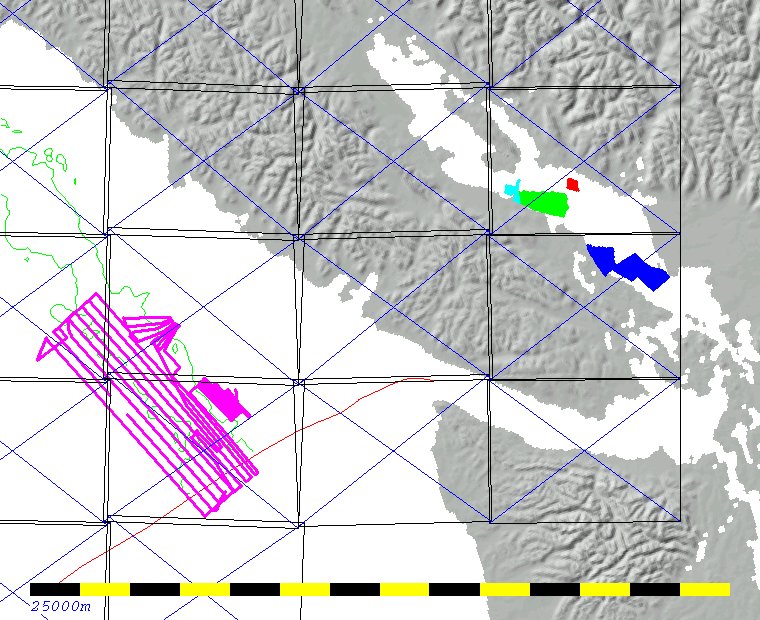
10
m pixel < 1500m |
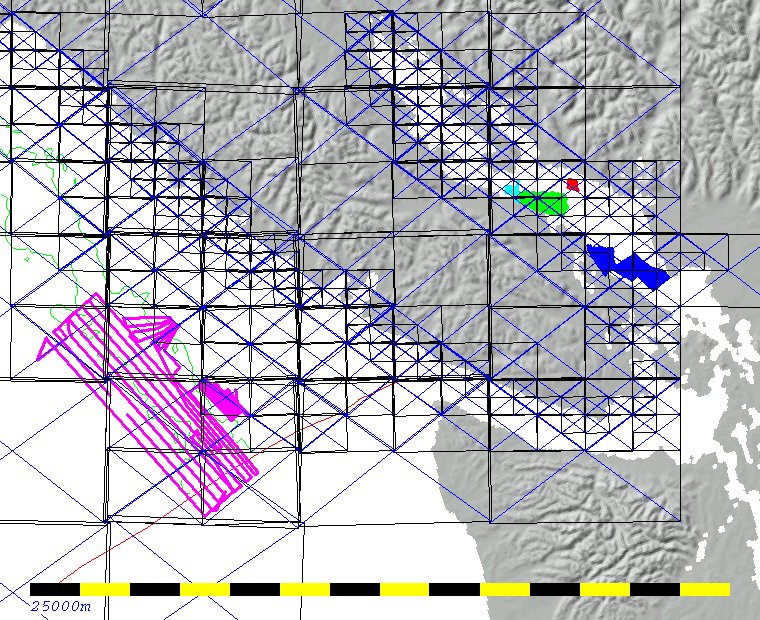
5
m pixel < 400m |
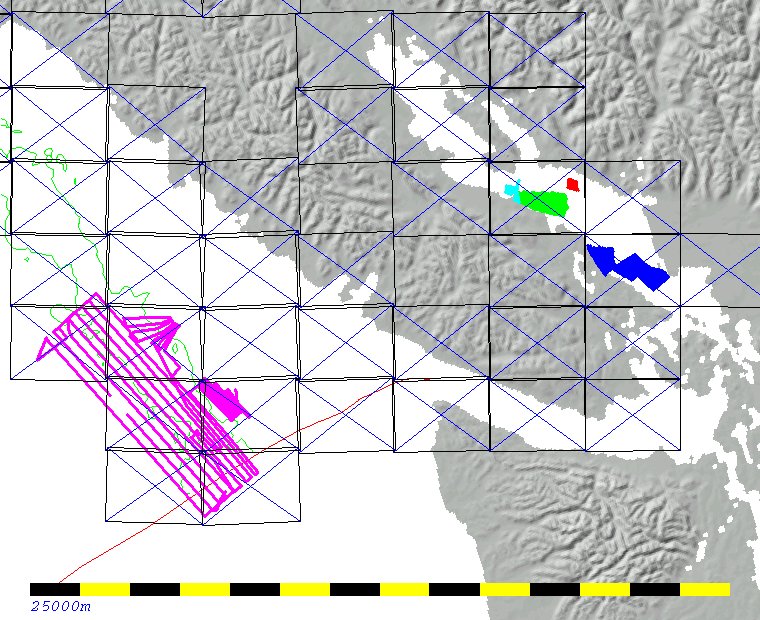
2.5
m pixel < 100m |
 |
 |
 |
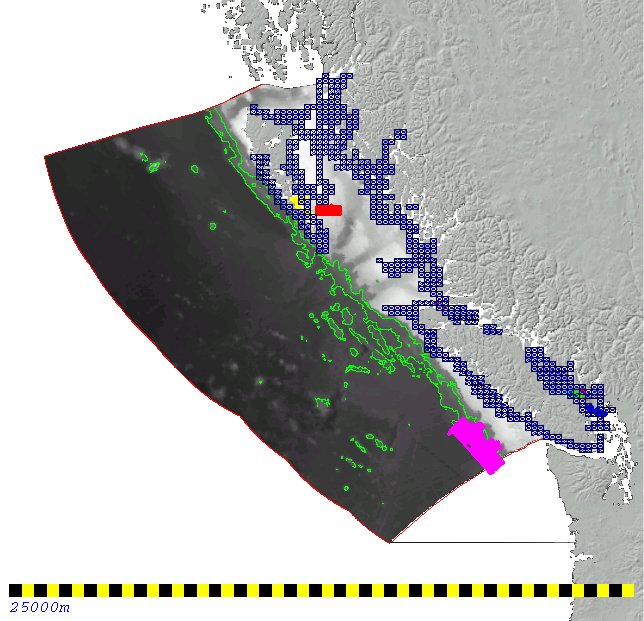 |
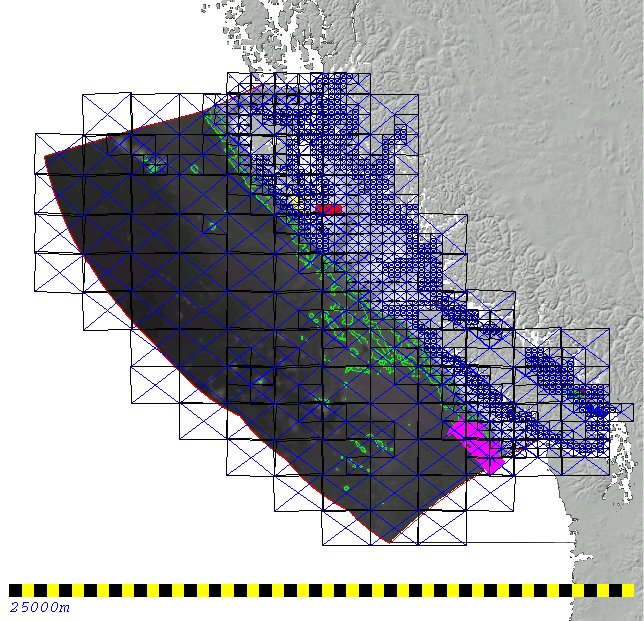
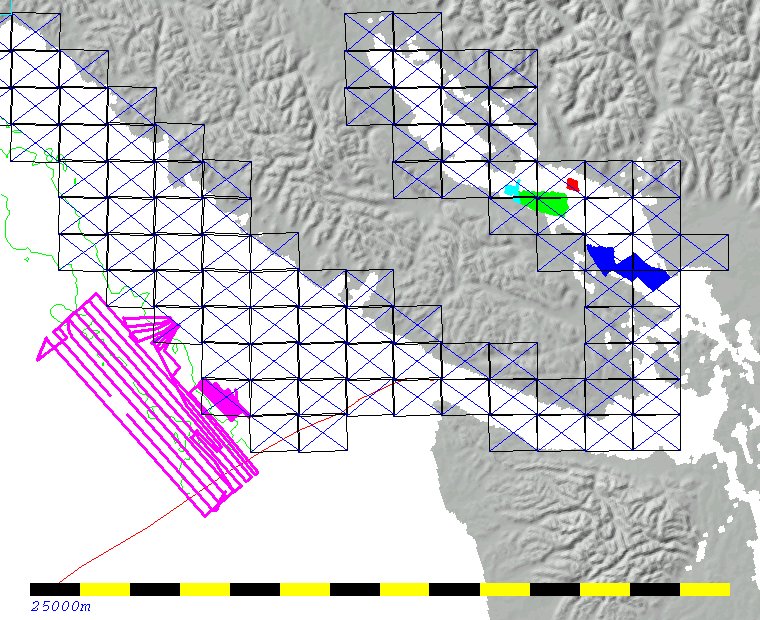
| 40
min lat x 80 min lon |
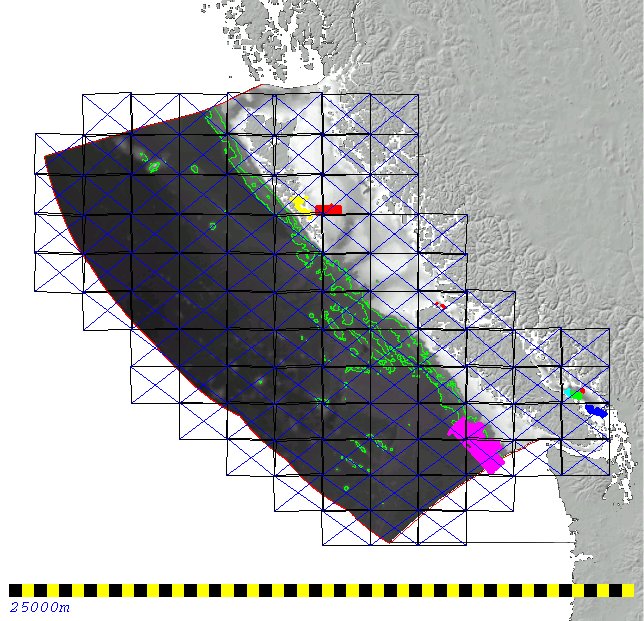
20
min lat by 40 min lon |
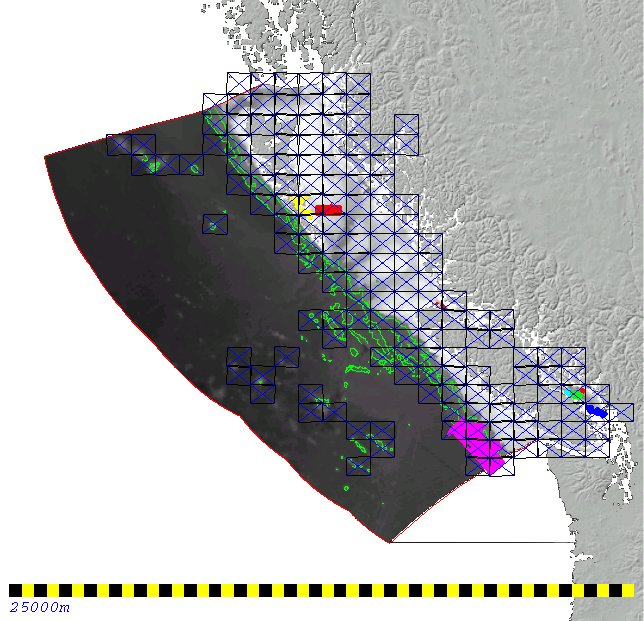
10
min lat by 20 min lon |
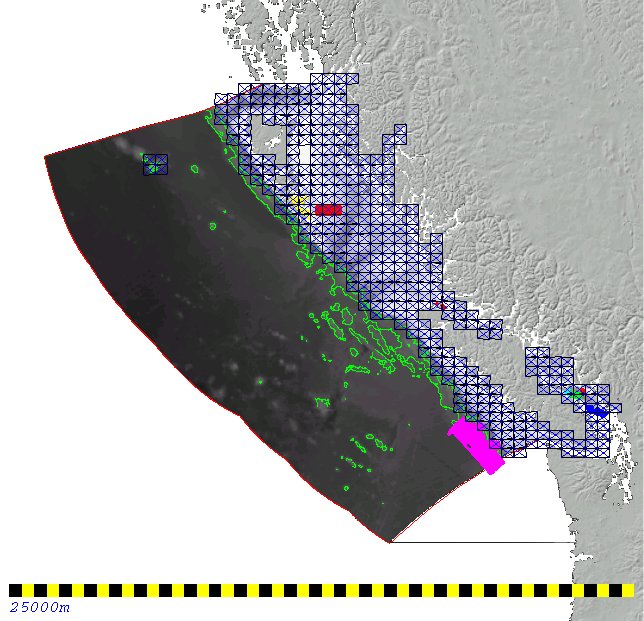
5
min lat by 10 min lon |
 |
 |
 |
 |
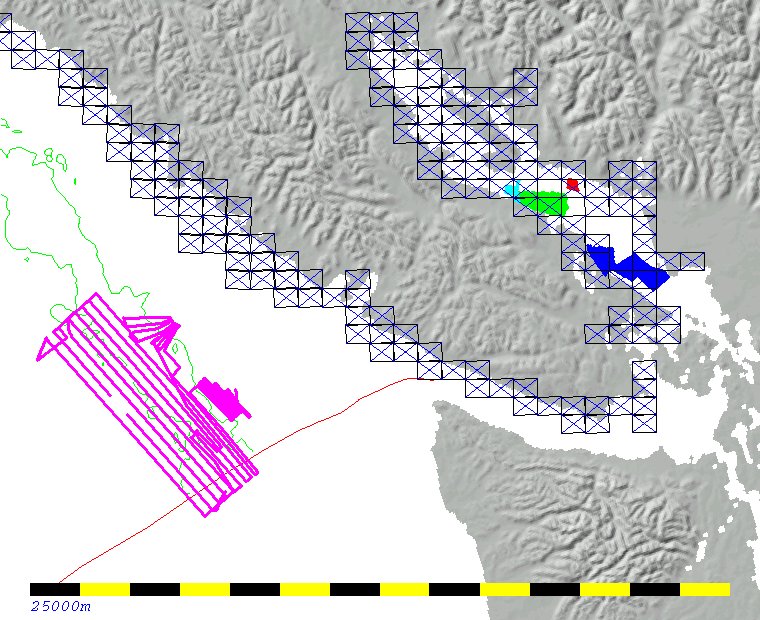 |
| all quads |
40x80 |
20x40 |
10x20 |
5x10 |