back to:

Report
Index

C-Nav Heights v. WebTide
RV Celtic Explorer Cruise CE17-01
Chief Scientist: Kevin Sheehan, MI
July 22nd to August 6th 2017
John E. Hughes Clarke
Anand Hiroji
Jose Cordero Ros
Center for Coastal and Ocean Mapping
University of New Hampshire

Overview:

The MI approach to vertical referencing is based on ellipsoid height solutions derived from CNav RTG solutions. Those are reduced to a chart datum using the VORF model. In contrast, an alternate approach is to use the global tidal model HRGlobal that is available through WebTide. This is the FES2004 model of the French Tidal Group led by C. LeProvost (Which includes M2,S2,N2,O1,K1,M3,M4,M6 and MS4). This page compares and contrasts those two solutions.

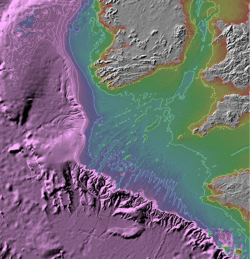
topo
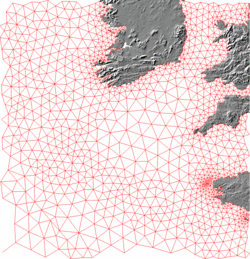
HRglobal mesh
egm08
GEBCO bathymetry of the Celtic Sea
50m contours on shelf and to 500m
HRGlobal mesh density in the Celtic Sea
showing node spacing
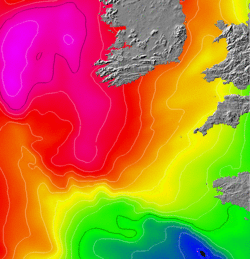
EGM08 Ellipsoid-Geoid Separation Model
10m contours in black - 1m in white
range 46 (blue)-62 (pink) m.


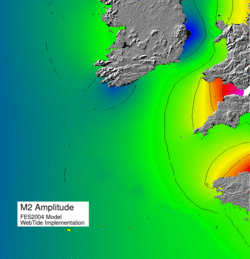
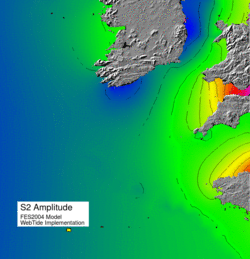
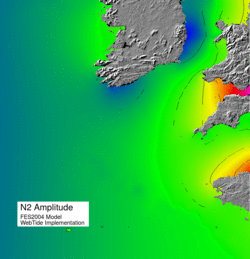
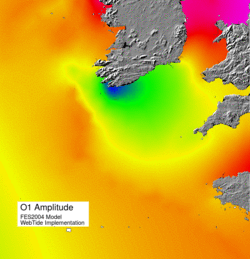
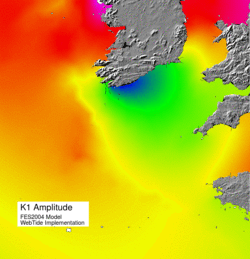
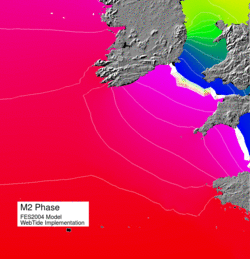
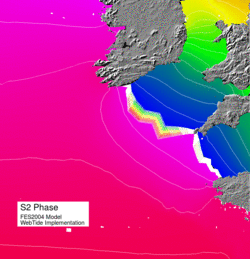
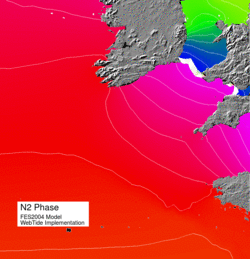
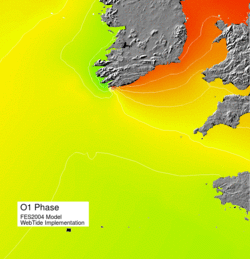
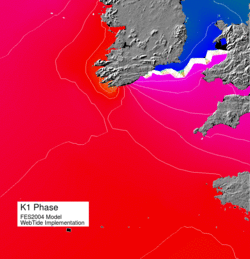
To put it all in context, the tidal variability in the Celtic Sea needs to be understood. The following figures show the variation in tidal amplitude and phase for the 5 major tidal constituents

M2
S2
N2
O1
K1
M2 amp
S2 amp N2 amp O1 amp K1 amp
range: 0.5-4.0 m
range: 0.2-1.5 m
range 0.1-0.8 m
range: 0.01-0.115 m
range: 0.01-0.15 m
Tidal Amplitude (m)

M2 phase
S2 phase N2 phase O1 phase K1 phase
Tidal Phase
(-180 to +180) relative to Greenwich

As can be seen, the semi-diurnal constituents are much larger so there is little diurnal inequality. The phase maps illustrate that, for the semi-diurnal constituents, the tidal phase progresses to the NE from the shelfbreak across the Celtic Sea into the mouth of the Irish Sea. And in that space, the amplitudes grow eastward across the Celtic Sea.

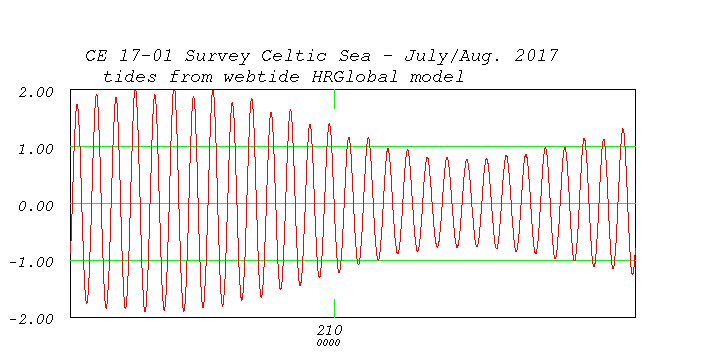
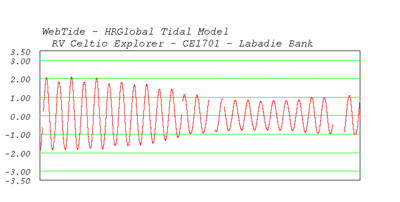
The net result is an M2 dominated tide with a spring range of about 4m and a neap range of about 2m. The plot below shows the progression of the tide over the two week period in the CE17-01 survey area. Note that the Webtide solution is referenced to mean sea level (MSL).  To shift to a chart datum, a ~ 2m offset would be required (depending on one's interpretation of LAT or equivalent).

ce1701 perido tides
tides for the 2 week period of the CE17-01 mapping survey
(from WebTide HR Global in centre of survey area)


For all the analysis below, the CNav RTG height solutions have been extracted from the logged NMEA telegrams in the EM data files.  Additionally a second ellipsoid height is derived from the Seapath positioning. It provides a height solution that appears much better than differential, but not as good as CNav. At this time it is not clear what aiding the Seapath is getting.

webtide
WebTide - HRGlobal

This is the WebTide solution, based on inputting the instantaneous time and position of the vessel as it moves back and forth across the HRGlobal triangulated network (see mesh diagram above) available in this area.

CNav Geoid heights
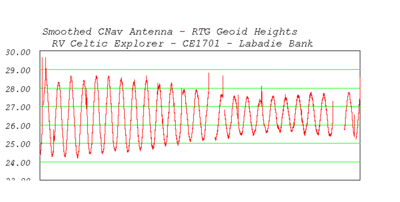
CNav - RTG Geoid Heights - Smoothed
LEFT: These are the antenna heights provided in real time, shifted according to the EGM08 ellipsoid separation model and then low-pass filtered to remove the heave.
As can be seen, a very clean tide-like signal is clear, mimicking the spring to neap transition predicted by Webtide.
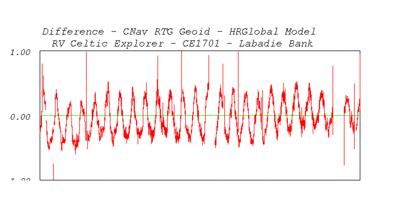
RIGHT: this is the difference between the smoothed antenna trajectory and Webtide solution (mean removed). As can be seen, the main residual is an M2 period signal with about 20cm amplitude - this is probably a failure of the global tide model. Superimposed on that is a long period drifting which is probably the non-tidal residual due to the two low pressures and gales that passed through during the survey.
diff v webtide
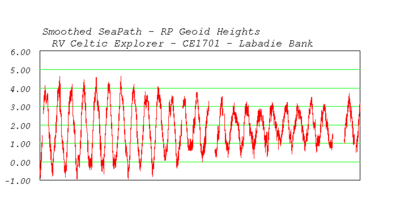
Seapath Geoid heights. Seapath RP Geoid Heights - Smoothed

LEFT: These are the similarly filtered height solutions available out of the Seapath 330+ system. The same spring neap ctycle is seen, but now with a superimposed noise.
Note that they are a trajectory of the RP, not the antenna. They have already been reduced to the geoid and reflect the WLZ value seen in the installation telegrams

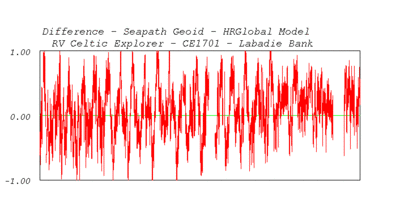
RIGHT: the differences w.r.t. Webtide. The same M2 residual is seen, but superimposed now is a higher noise content reflecting the lower vertical height quality coming out of the Seapath.
diff v webtide


unfiltered CNav
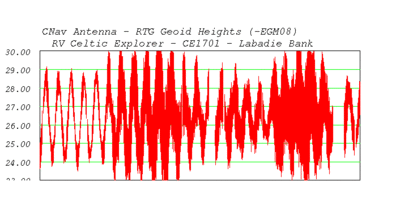
CNav Antenna RTG Geoid Height - unfiltered

This shows the vessel heave superimposed. One can clearly see the initially low seastate followed by the two gales events.

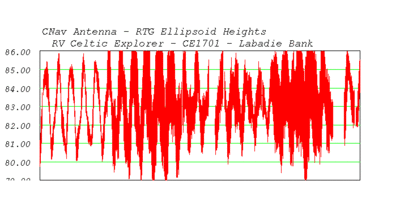
LEFT: the geoid trajectory  - RIGHT : the ellipsoid trajectory

The difference being the EGM08- separation model applied (averaging ~ 55m).
CNav ellipsoid
seapath unfiltered
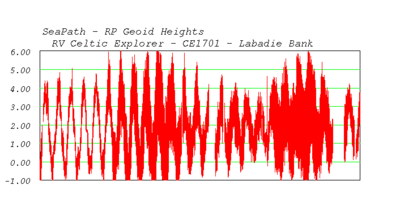
Seapath RP Geoid Height - unfiltered

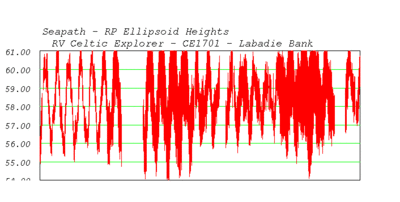
Similarly with heave included. At low seastates one can see the vertical noise anomalies that show up in the filtered data superimposed.

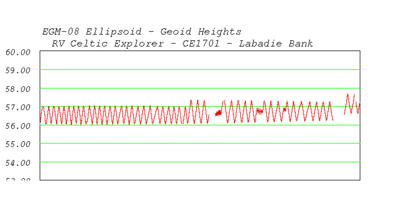
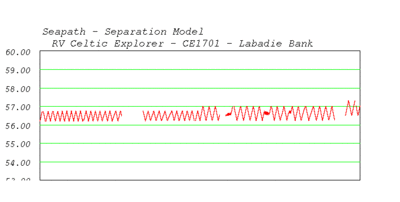
Same ~55m offset. However, as is seen from the following two plots, the internal Seapath separation model and the EGM08 model differ in their opinion of the separation surface slope in the CE1701 area.

Seapath Ellipsoid


egm08
EGM08 Separation Model

  Using the shiptrack, this shows the variation in the EGM08 Ellipsoid-Geoid model as the vessels steams back and forth from East to West.

Seapath separation
Seapath embedded Separation Model

Derived directly from the INGGA telegrams output from the Seapath.

As can be seen, this is clearly not EGM08. It predicts that the slope of the separation surface is flatter than EGM08.


page composed offshore --  JEHC