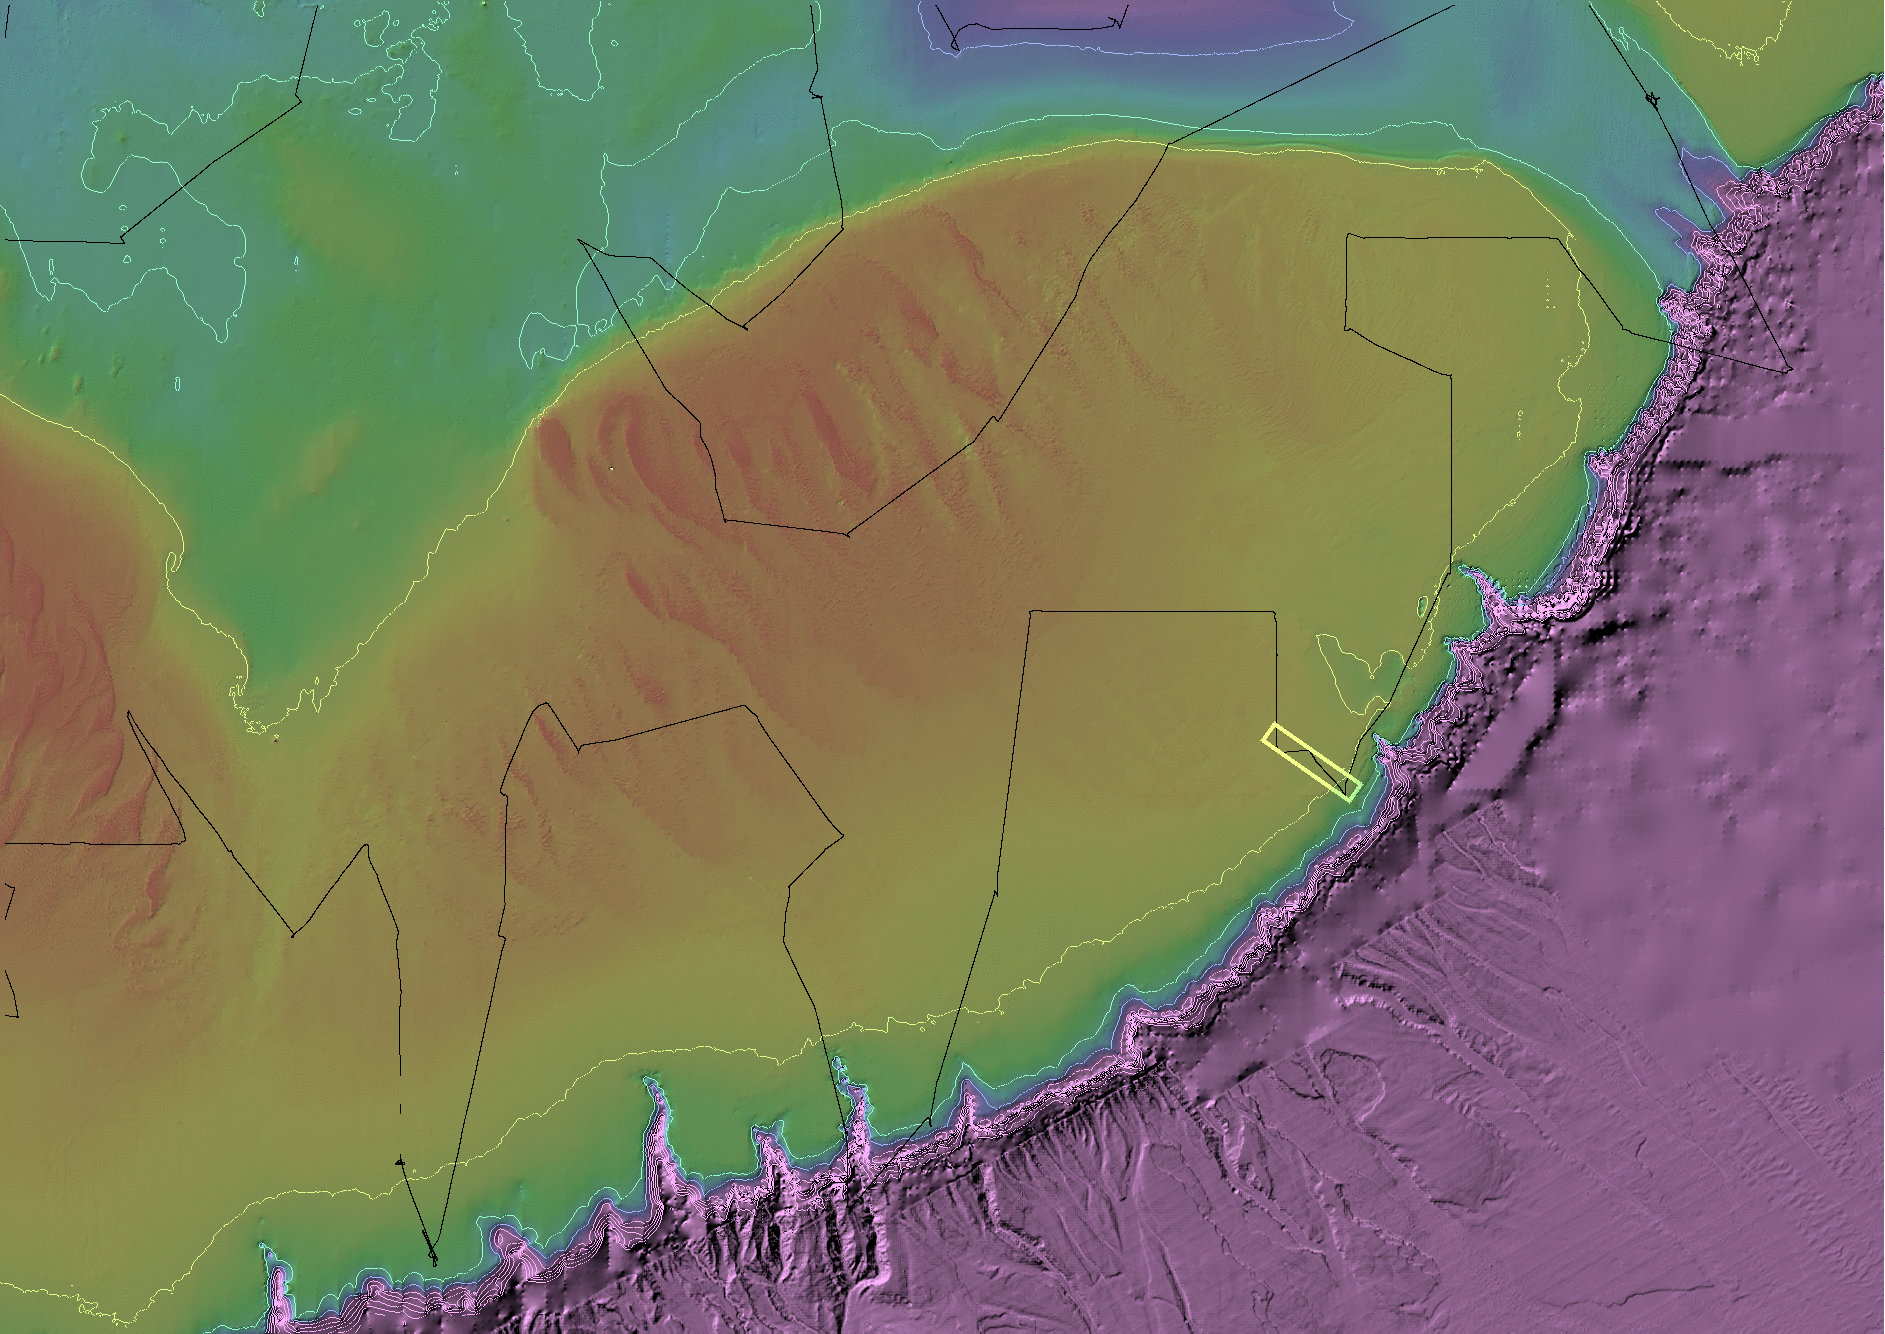
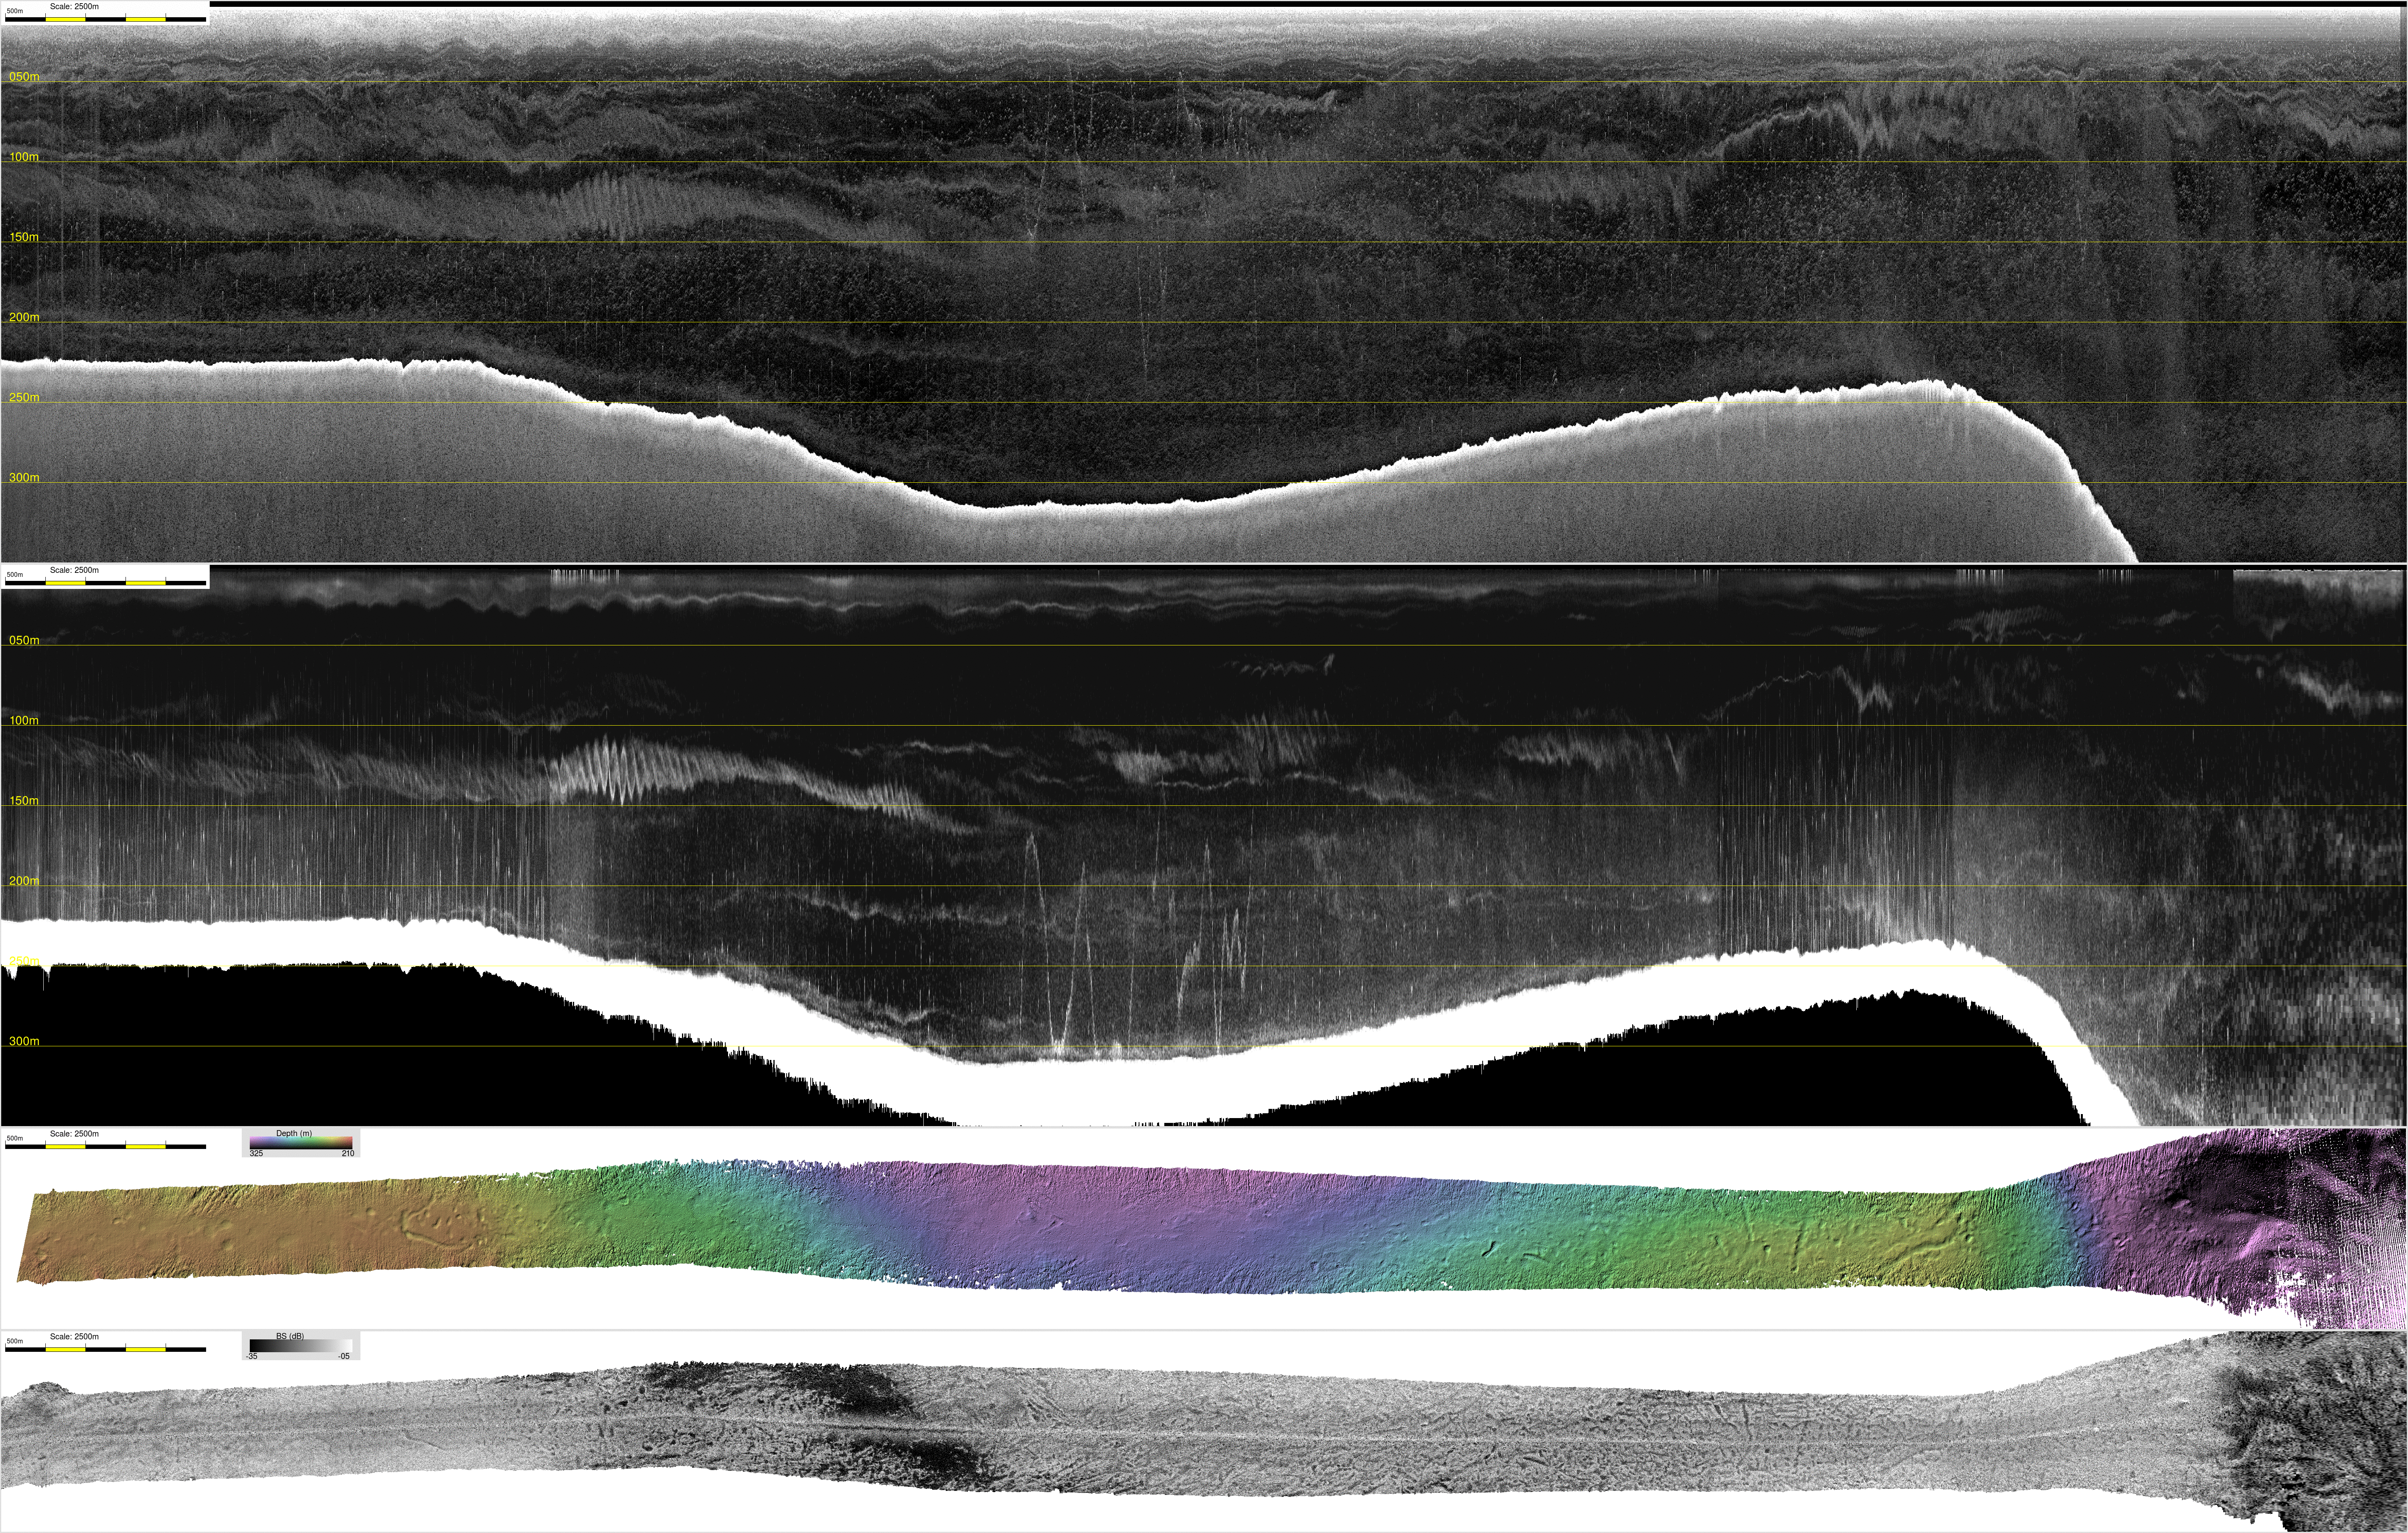
map illustrating the section investigated (white rectangle)
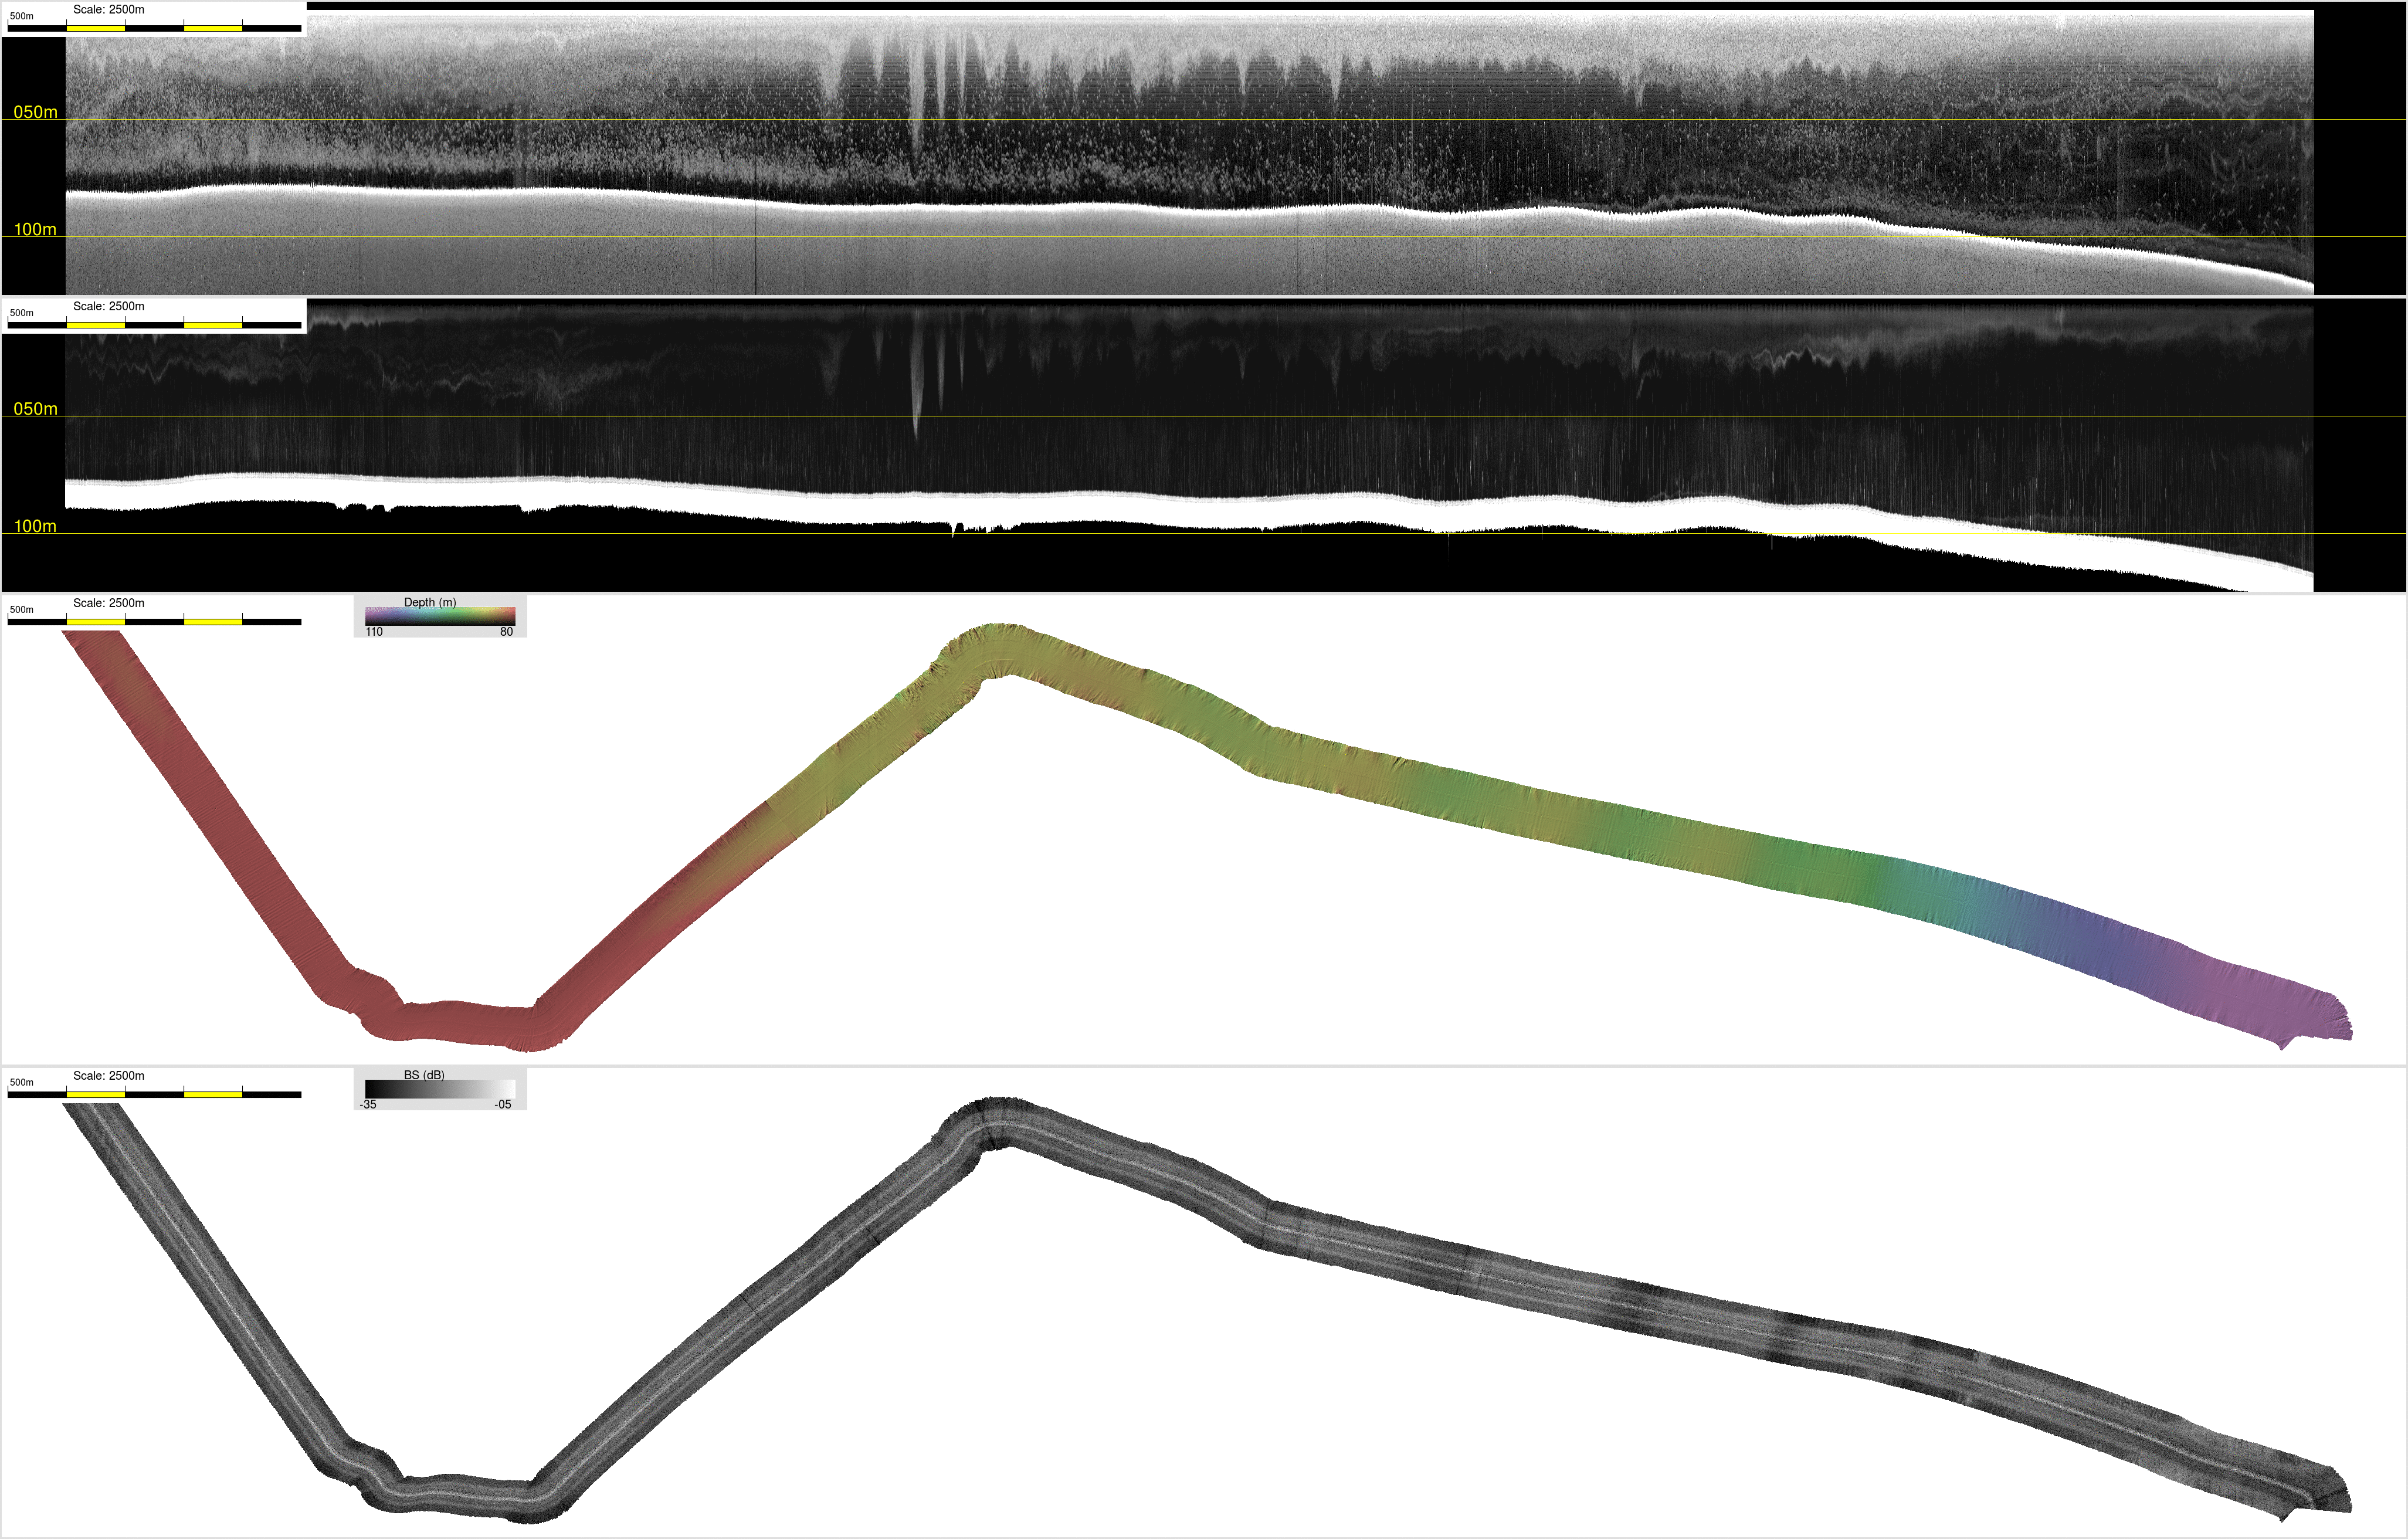
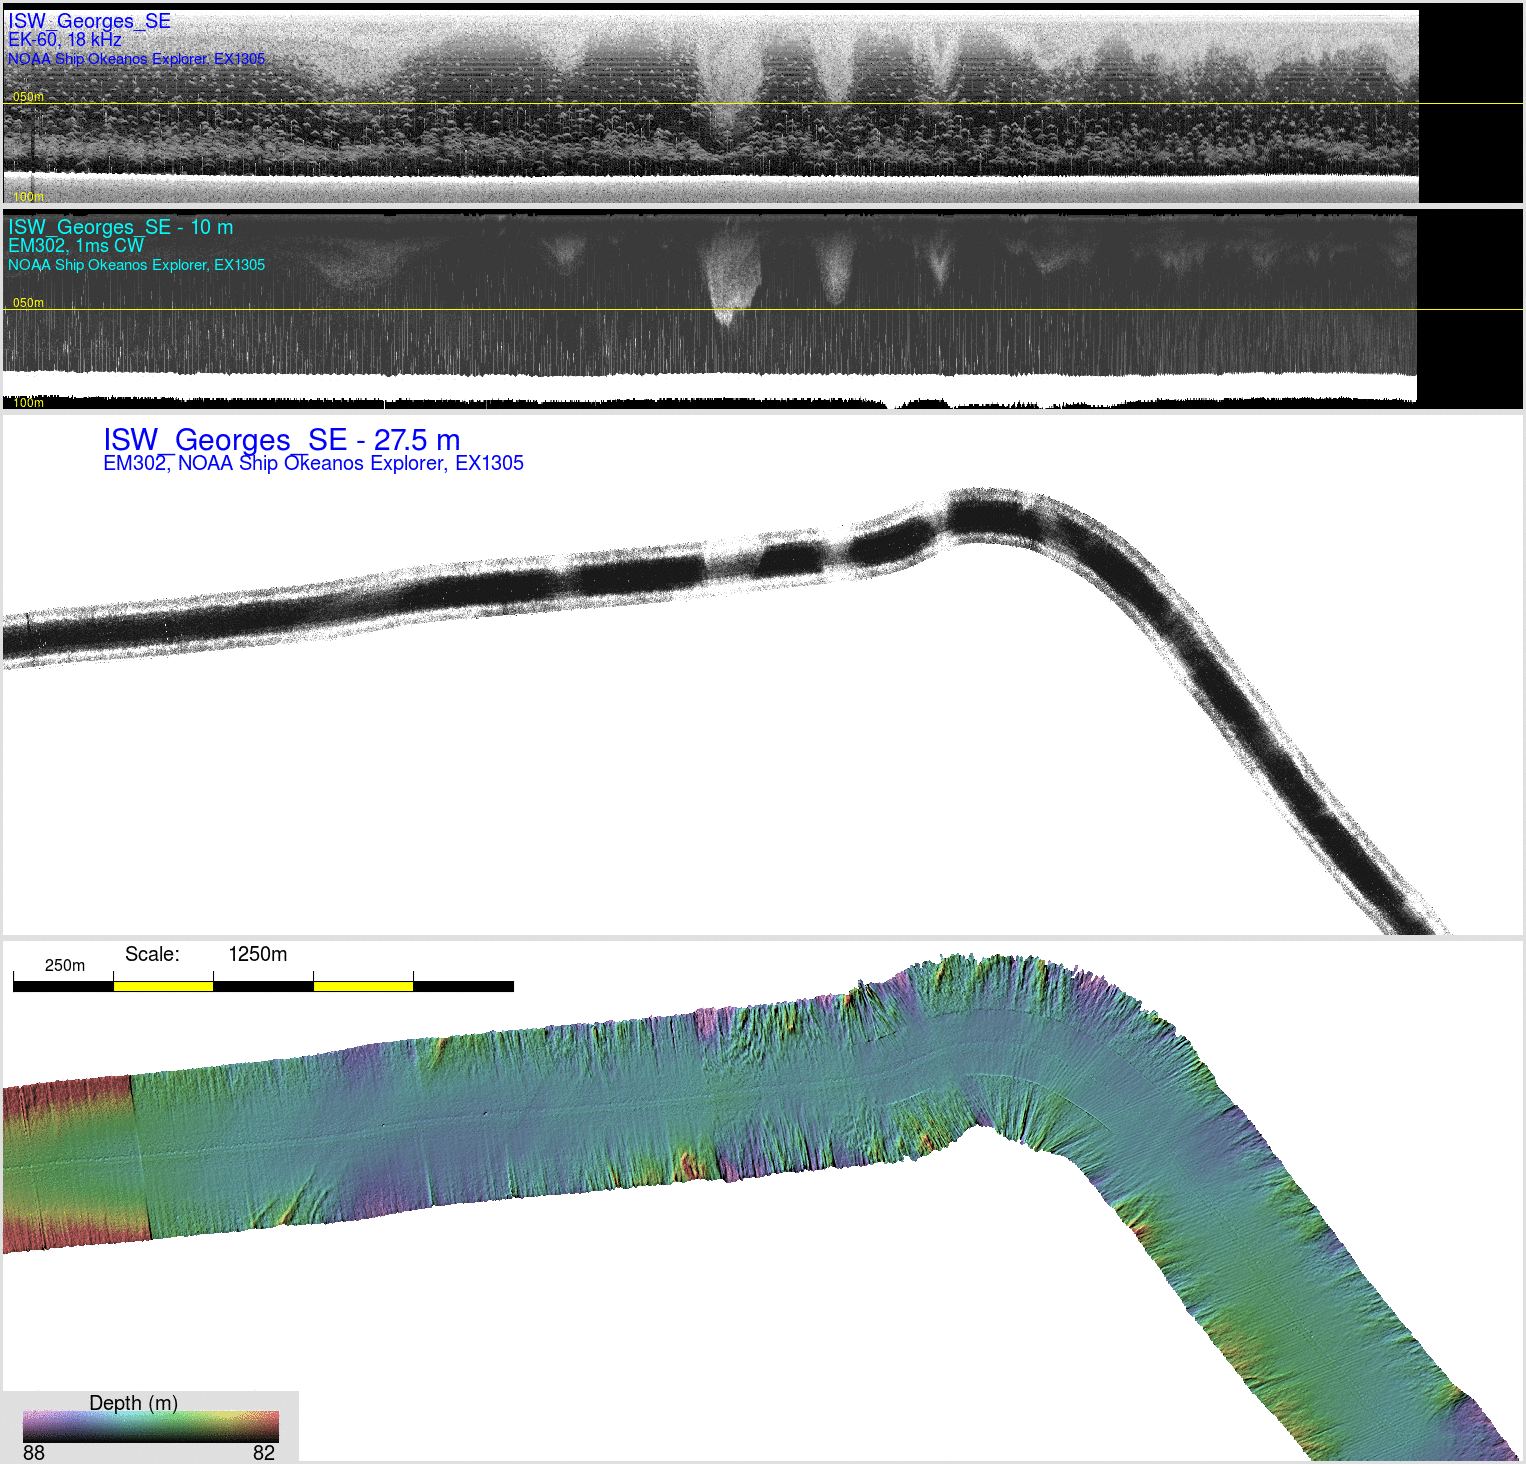
combined plot of :
- EK60 18 kHz volume scattering
- EM302 30 kHz volume scattering
- EM302 bathymetry
- EM302 seabed backscatter.
| John E. Hughes Clarke Professor, CCOM, UNH |
Indra Prasetyawan PhD student CCOM |

 |
 |
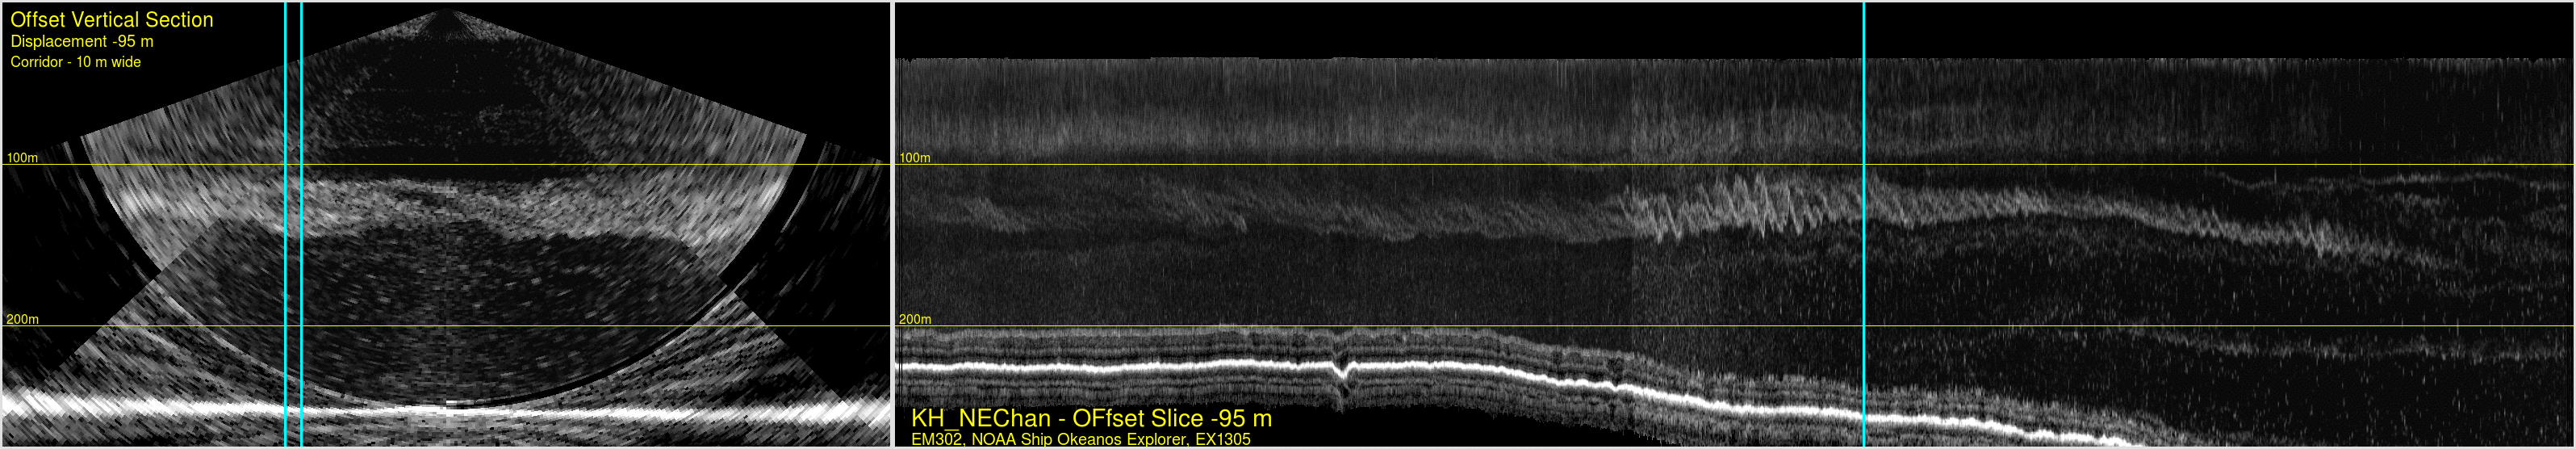
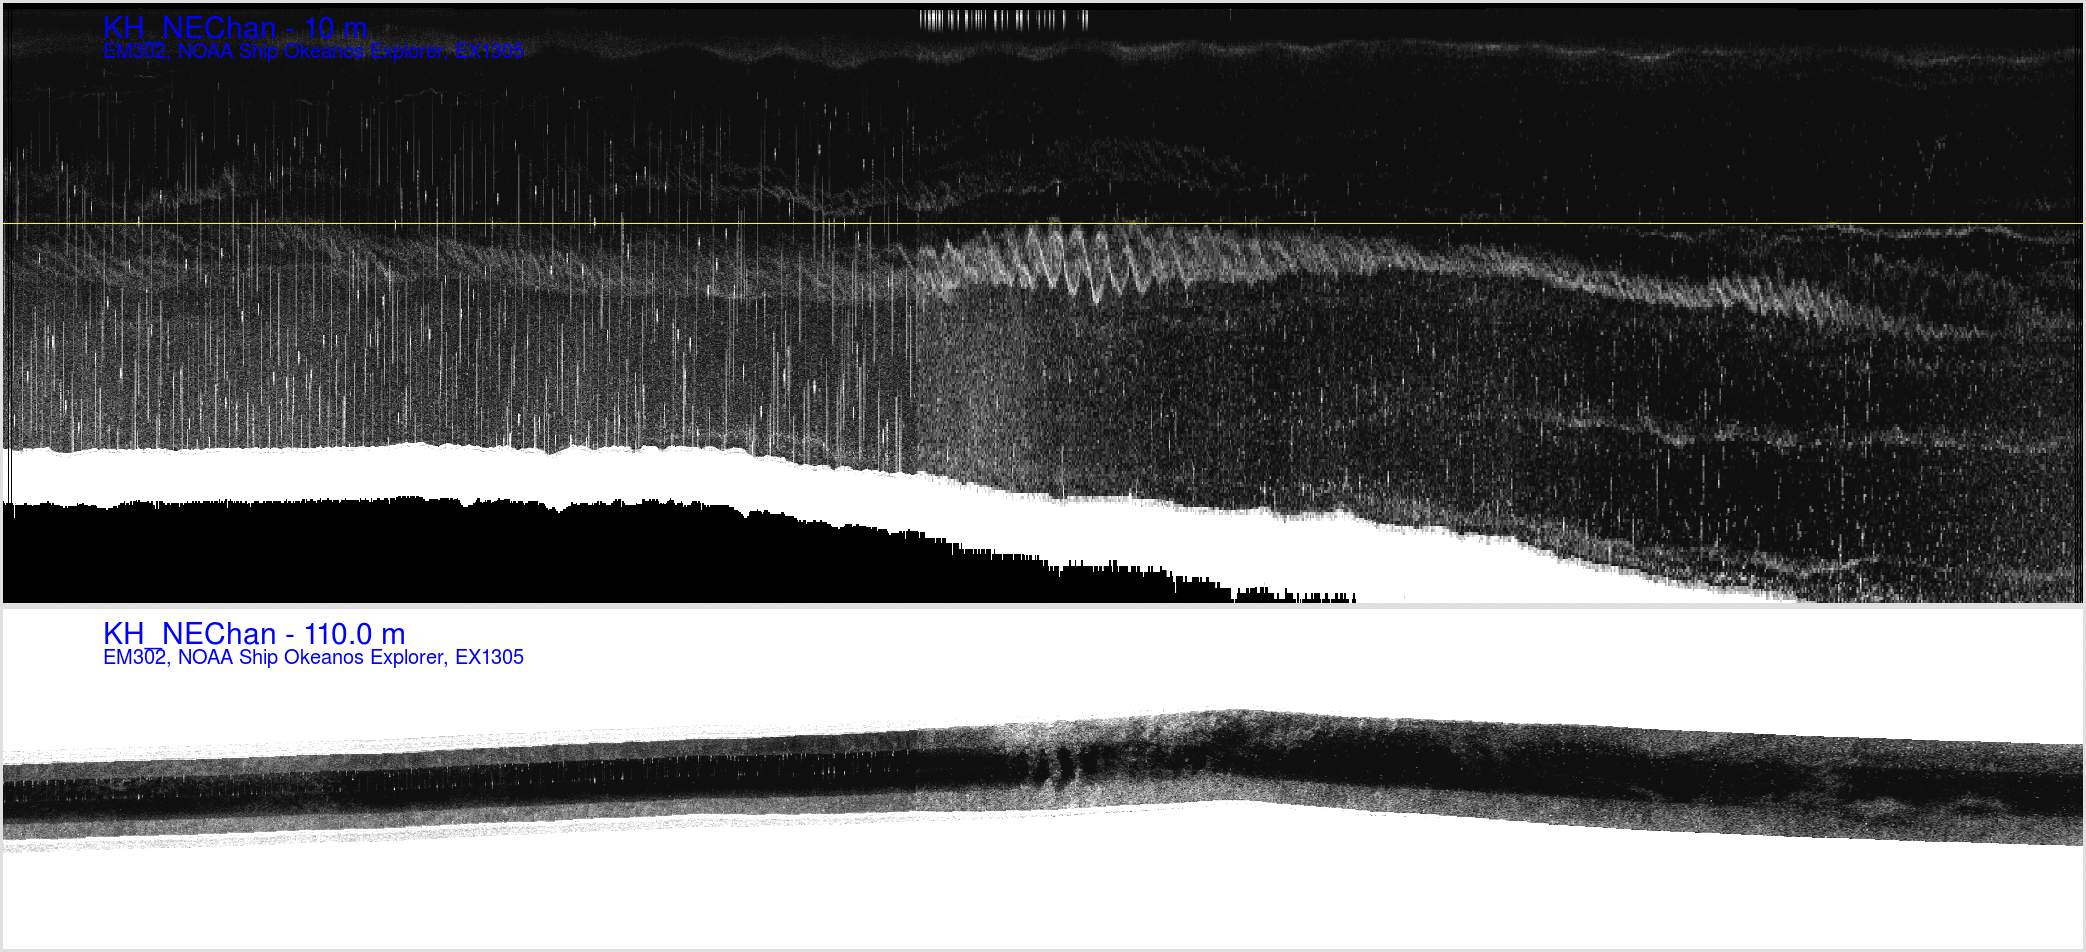
| individual swaths without
along track averaging |
two swath averaging. |