US-Canada
Border Backscatter Calibration Site
EM712 Reference Data Collection
CSL Heron - April 10th 2022
John E. Hughes Clarke, Miguel Candido, Brandon Maingot
Center for Coastal and Ocean Mapping
University of New Hampshire
version - 13th April
2022
Overview
There is a growing need to provide a means of absolutely calibrating
the seabed backscatter strength measurements collected by multibeam
sonars operating within US (and Canadian, Portuguese and Brazilian)
waters. In the US, there is a new impetus, driven by the 2019
Presidential Memorandum on Characterizing the US EEZ.
This preliminary web pages outlines details of a new absolute
backscatter calibration site, ideal for an EM712, that lies along
the US/Canada border in protected waters which would be a suitable
test location for any US or Canadian vessel to compare against on an
opportunity basis.
This builds on a 2019 experiment using calibrated split beam sonars,
that took place from the CSL Heron within shallower adjacent
Canadian waters off Sidney BC. The aim is to transfer that
calibration to a deeper water location along the border. The short
term drive is to allow the NOAA Ship Fairweather (FA), which should
be transiting past in May, to inherit that calibration for her newly
installed EM712.

Showing location of 2019 EK-80 calibration work
and location of 2022 transfer of that calibration
The CSL Heron backscatter calibration experiment builds on a
long-standing collaborative relationship between four partners:
- University of New Brunswick
- University of New Hampshire
- Canadian Hydrographic Service, (DFO)
- Office of Coast Survey (NOAA)
Site Location
To avoid administrative overhead, the site was chosen to lie exactly
along the US-Canada border in the eastern end of the Strait of Juan
de Fuca, between Victoria and Port Angeles. The site was chosen to
deliberately avoid the heavy commercial vessel traffic that is
directed through specific shipping lanes in the area.
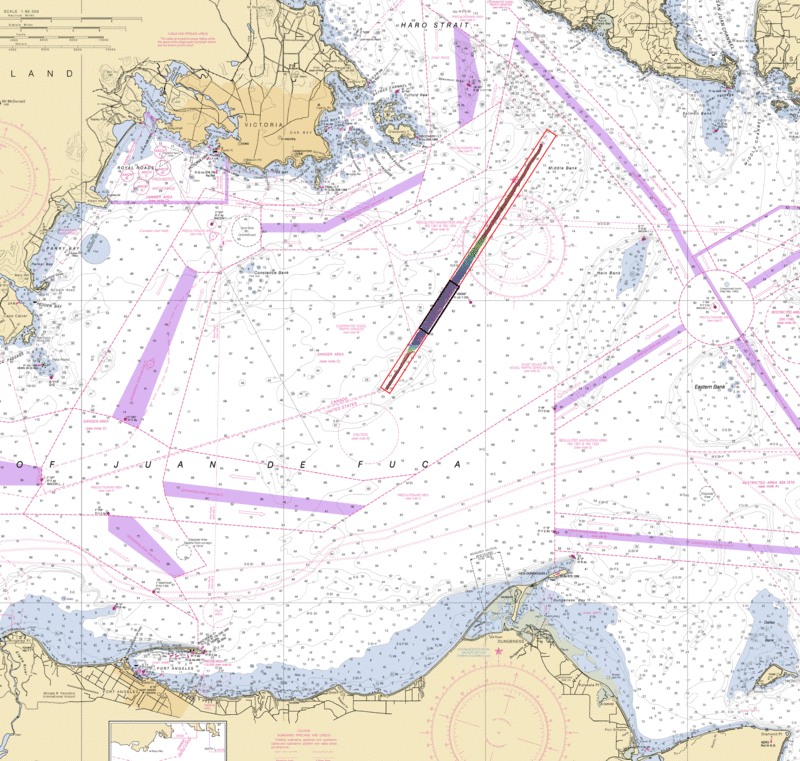 location map showing section along US-Canada Border outside
shipping lanes
location map showing section along US-Canada Border outside
shipping lanes
Red rectangle was the original reconnaissance section
Black rectangle is the focus calibration site.
To establish the best site, the full SW-NE section of the border was
run as a reconnaissance. 30-50m deep shoal areas exist at
either end (perhaps suitable for EM2040 calibration in the future?).
To be most amenable to EM712 calibration (in which the shallowest
mode is routinely used to 100m) the deepest, lowest relief and
most homogeneous backscatter section was selected.
full 9300m long border reconnaissance
transect (SW to left, NE to right) showing:
- EM712 water column
- EM712 backscatter
- EM712 bathymetry
- chart identifying legal border
From the full 9 km section a ~3.5 km long sub-section (20 minutes at
6 knots) was selected. The morphology in the area is relatively
smooth (varying only 10m within the nearly 2 nm transect). And the
backscatter strength is relative uniform and, most importantly
perhaps, anomalous high (averaging ~ -5dB) and without any
discernible specular component. This suggests that the seabed
consists of washed cobbles and gravels which respond in a typically
Lambertian manner. Such seafloor sediments are common in the tidally
swept area here.
To illustrate the homogeneity, a representative ~600m wide
bathymetric grid and backscatter swath through the reference
calibration area is presented below:
 chosen section - 3450m long - acquired by CSL
Heron (EM712, 70-100 kHz, Very Shallow Mode)
chosen section - 3450m long - acquired by CSL
Heron (EM712, 70-100 kHz, Very Shallow Mode)
bathymetry - colour scale from 102m to 112m
backscatter - grey scale from -12.5 dB to +(!)2.5 dB
(top , before sector-balancing , middle, after)
Previous Work
In 2019, Ivan Guimaraes collected EK-80 data using a calibrated set
of split beam transducers (ES-70, ES-120, ES-200 and ES333) which,
by chirping each through their full bandwidth provides backscatter
measurements over the range 45 to 450 kHz.. This is used to derive
the backscatter strength "truth" (see his MSc thesis, UNH 2020)
for details. This was collected over 5 sites in the Sidney area in
depths ranging from 15 to 55m.
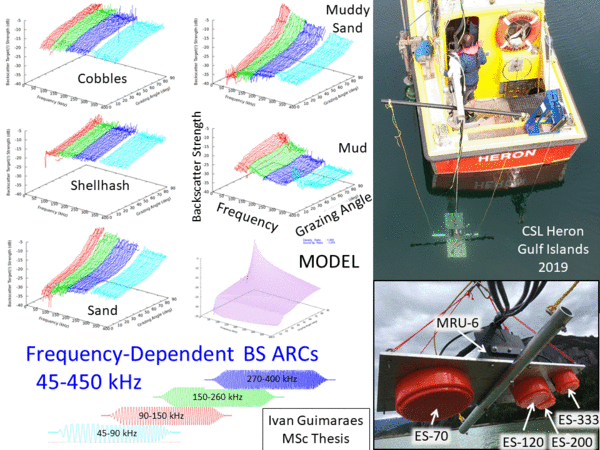
Showing 2019 experimental method - 4 chirped EKs
covering 45-450 kHz
suspended below CSL Heron, rotated in elevation and azimuth.
Resulting "truth" at 5 locations
At the time, data from the multibeams then installed on the CSL
Heron including EM710 (SIS-4 .all) and EM2040P (SIS-5 .kmall)
were collected to try and also calibrate them. That EM data together
with a new 2022 dataset including the new EM712 (SIS-5 .kmall) and
EM2040C (SIS-5 .kmall) was just collected by Miguel Candido (MSc in
progress, UNH).
Miguel is currently using the archived "truth" to attempt to
absolutely calibrate the CSL Heron EM712 (a 1x 2 degree system)
backscatter strength observations. As a result, in theory (....) the
Heron now represents a "golden" calibrated system. Thus it can now
move to different areas and collect a reference dataset, against
which other EM712s can compare.
This is the intent of this program in which a new 40-100 kHz
backscatter reference site is being developed. It would be
administratively complicated for the FA to steam directly into
Canadian waters to occupy the sites off Sidney (and additional
complications include the fact that it is an area with restricted
maneuvering, relatively heavy ferry and recreational boating
traffic). As an alternate approach, on April 10th, the CSL Heron
EM712 system was deployed to the US-Canada border line in an area
both outside the shipping lanes and away from coastal restrictions.
The site chosen (illustrated in the chart extracts above) is
directly in the transit path of the FA as it relocates from
Newport/Seattle to Ketchikan, Alaska (assuming it uses the inside
passage). All data collection can be performed within US waters
(simply by steaming 1/2 a boat's width to the SE of the border).
CSL Heron EM712 Data Collected
To provide a reference backscatter data set using the typical pulse
lengths and frequency ranges of a standard EM712, the CSL Heron
collected data at ~6 knots along the chosen border transect on April
the 10th 2022. The following permutations were collected:
- 70-100 kHz
- Very Shallow Mode
- Shallow Mode
- Medium Mode
- "40" kHz (40-70 kHz)
- Very Shallow Mode
- Shallow Mode
- Medium Mode
Additionally EM2040C data were collected using 300 kHz for all modes
from : Shallow/Medium/Deep/VeryDeep/ExtraDeep/ExtremeDeep.
A preliminary relative (inter-sector, inter-swath,
inter-pulse-length, inter-frequency) backscatter calibration was
performed. Typically +/-5 dB of correction needs to be applied to
remove the gross inter-sector offsets (up to 10 dB for the "40" kHz
mode outer sectors). The plot below illustrates the sector-specific
corrections estimated and applied.
Showing sector-specific sonar-relative beam
pattern corrections for the CSL Heron EM712
To demonstrate the effectiveness of the method, the plot below
illustrates that, when these relative corrections were applied to
the CSL Heron EM712 data collected in the 6 modes, the inter-sector,
inter-swath artefacts were very effectively removed.

Showing the impact of applying the relative sector-specific
calibration to CSL Heron EM712 data
acquired using 6 unique frequency/pulse length combinations.
- top - corrections
- centre - before application
- bottom - after application
Note that the example here is only a RELATIVE calibration.
Through the magic of Miguel's new algorithms, and working with
Ivan's reference data, the idea is to do an ABSOLUTE calibration
(the "Holy Grail").
Survey Line Recommendations for FA
Assuming that the FA is indeed passing through the Inside Passage on
its way to Alaska, this site is conveniently away from all major
shipping lanes. The coordinates for the 3450 m long reference base
line are provided (the one in which the reference data was acquired
on 10th April) and plotted on the chart below:
48.31657591 -123.21753805 SW end
of Line
48.34261491 -123.19237257 NE end of Line
location map of 3450 m long transect on
US-Canada border
(backdrop is NOAA Chart 18465 (depths in FATHOMS)
I believe... the border separates the responsibility for vessel
traffic reporting. On the Canadian side, vessel reporting is handled
by CCG Victoria Traffic. On the US side, it is handled by USGS Puget
Sound Vessel Traffic.
Ideally, after a quick CTD, the FA would collect a pair of
reciprocal lines along this transect for each operational mode of
the EM712. Including turns, this translates to ~ 1 hour of shiptime
per mode (2 x 20 minutes lines at 6 knots and probably about 10
minutes per line to turn around and do a run-in.).
Which Modes?.
At a minimum, I would expect the 70-100kHz modes to
be tested in dual swath (standard OCS/CHS hydrographic
survey settings). This would include at least the continental shelf
modes (Very Shallow, Shallow and Medium) and, given NMFS interest in
the upper slope, perhaps also Deep and Very Deep (Extra Deep implies
you need a lower F sonar). And if single swath is being used
routinely, then perhaps those permutations. Ideally, all data should
be collected at +/-70 degrees.
For my (JHC) interest, I would like to see the "40" kHz modes as the
centre frequencies are almost an octave lower. For hydrography,
however, this compromises the beamwidths (~ 2x fatter). But for some
seafloors this allows improved characterization. Note, however, that
as currently configured, the EM712 cannot hop between the two
frequencies ranges, so a second survey is currently required.
page generated, JEHC, Apr 13th 2022


