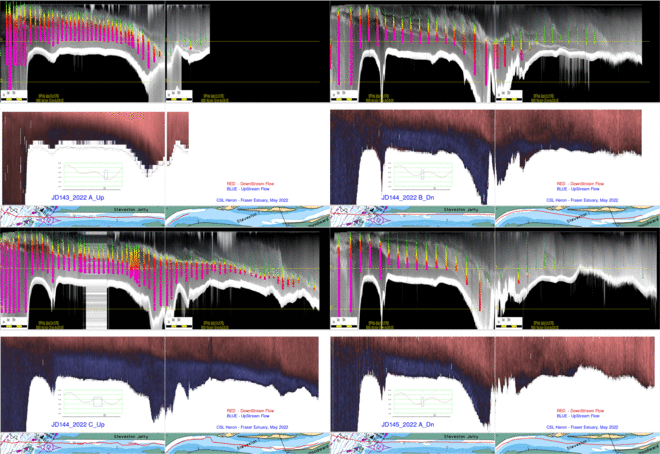
time sequence of salt wedge intrusion
Sands Head to Steveston, Fraser River Mouth
CSL Heron, May 23, 24, 25th, 2022
page version
May 30th 2022
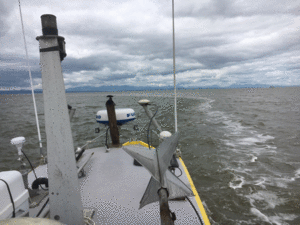
surface expression of river plume front
75 m depth, SE of river mouth
| John E. Hughes Clarke Center for Coastal and Ocean Mapping University of New Hampshire |
Mathew Wells Dept. Physical and Environmental Sciences University of Toronto |


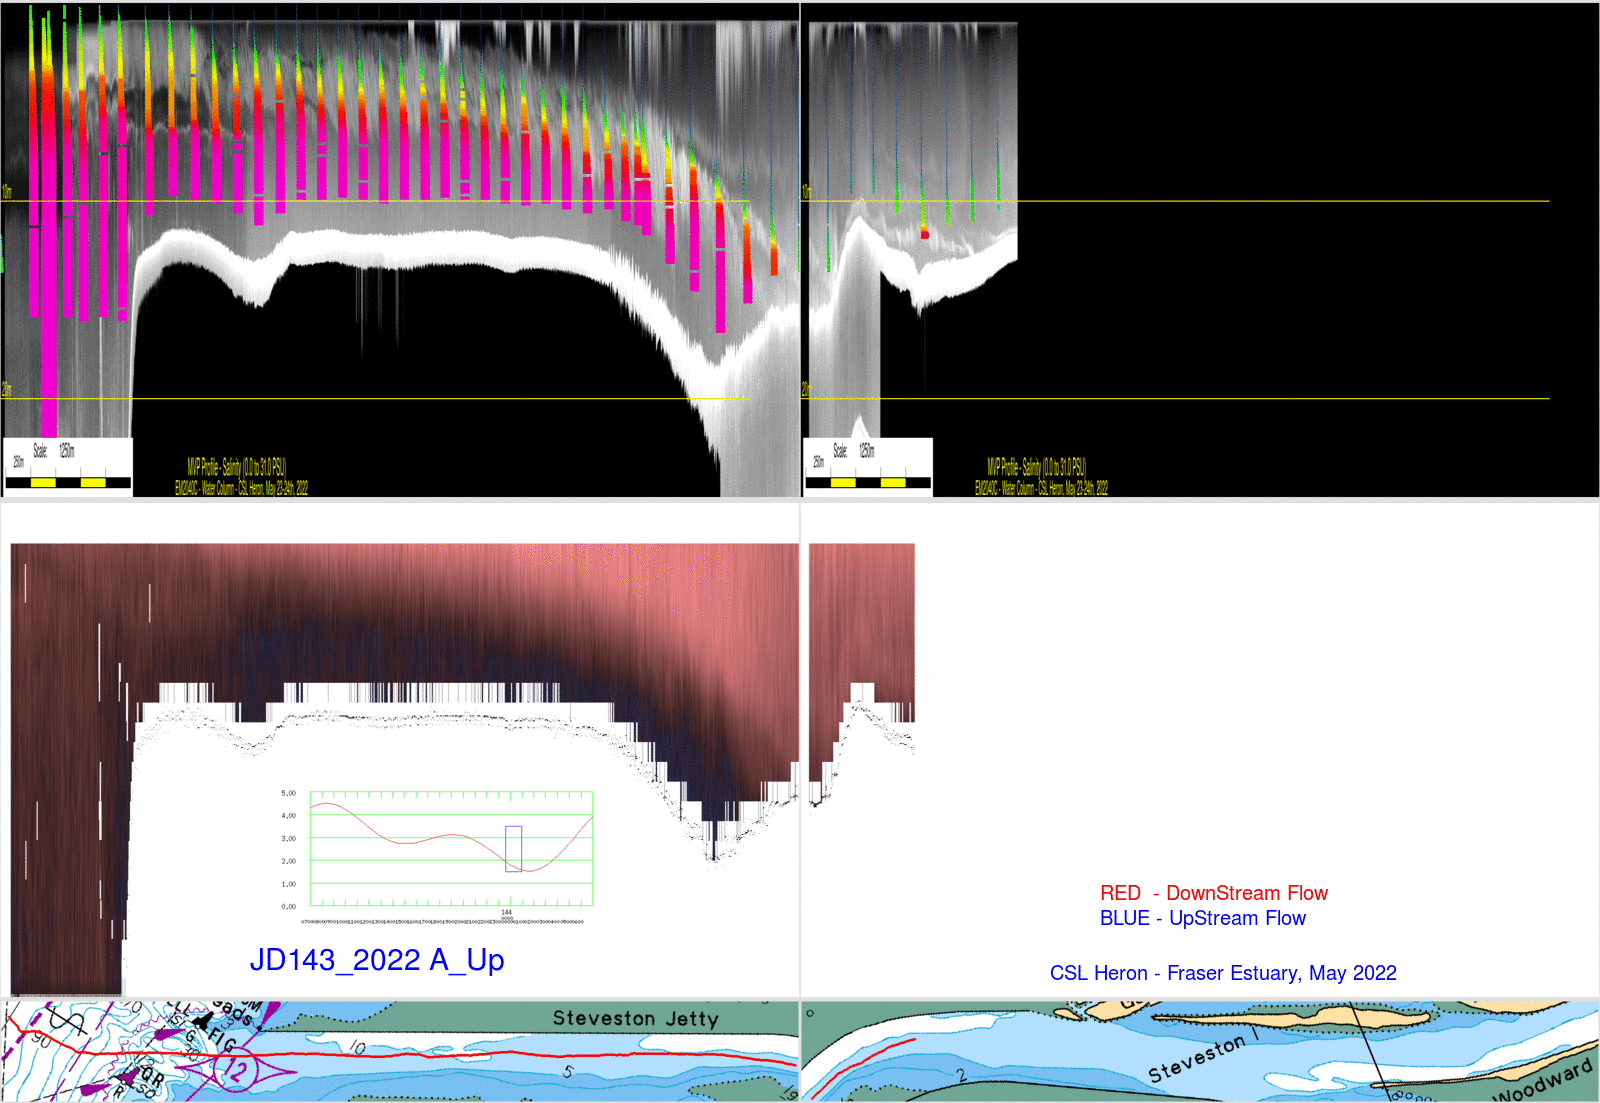
| May 23rd (JD 143) 2022 -
Section A (steaming upstream) |
|
| Comments: - Late ebb tide, lowest water level observed - salt wedge fully arrested. ADCP set to 1m bins (all subsequent surveys utilized 0.5m bins). clear presence of a warm subsurface layer coming in from the open ocean. |
|
 |
|
| Detailed Sections - click for
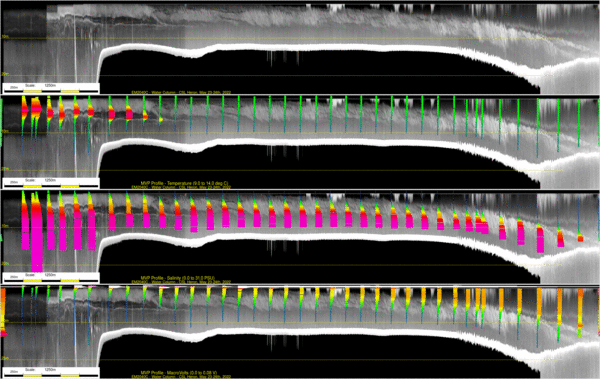
2.5m alongtrack resolution EM2040 WCD and MVP Temperature, Salinity and Optical Backscatter Overprinted. |
|
 |
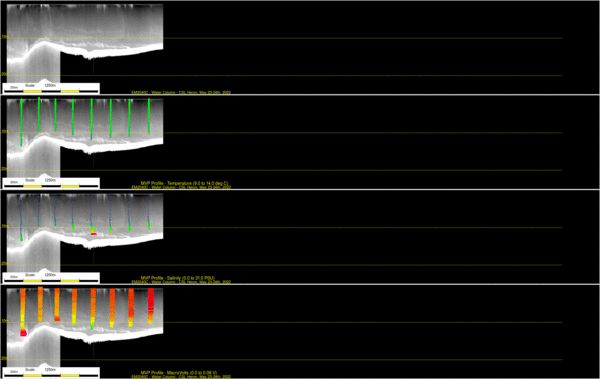 |
| all
mvp dips in line |
|
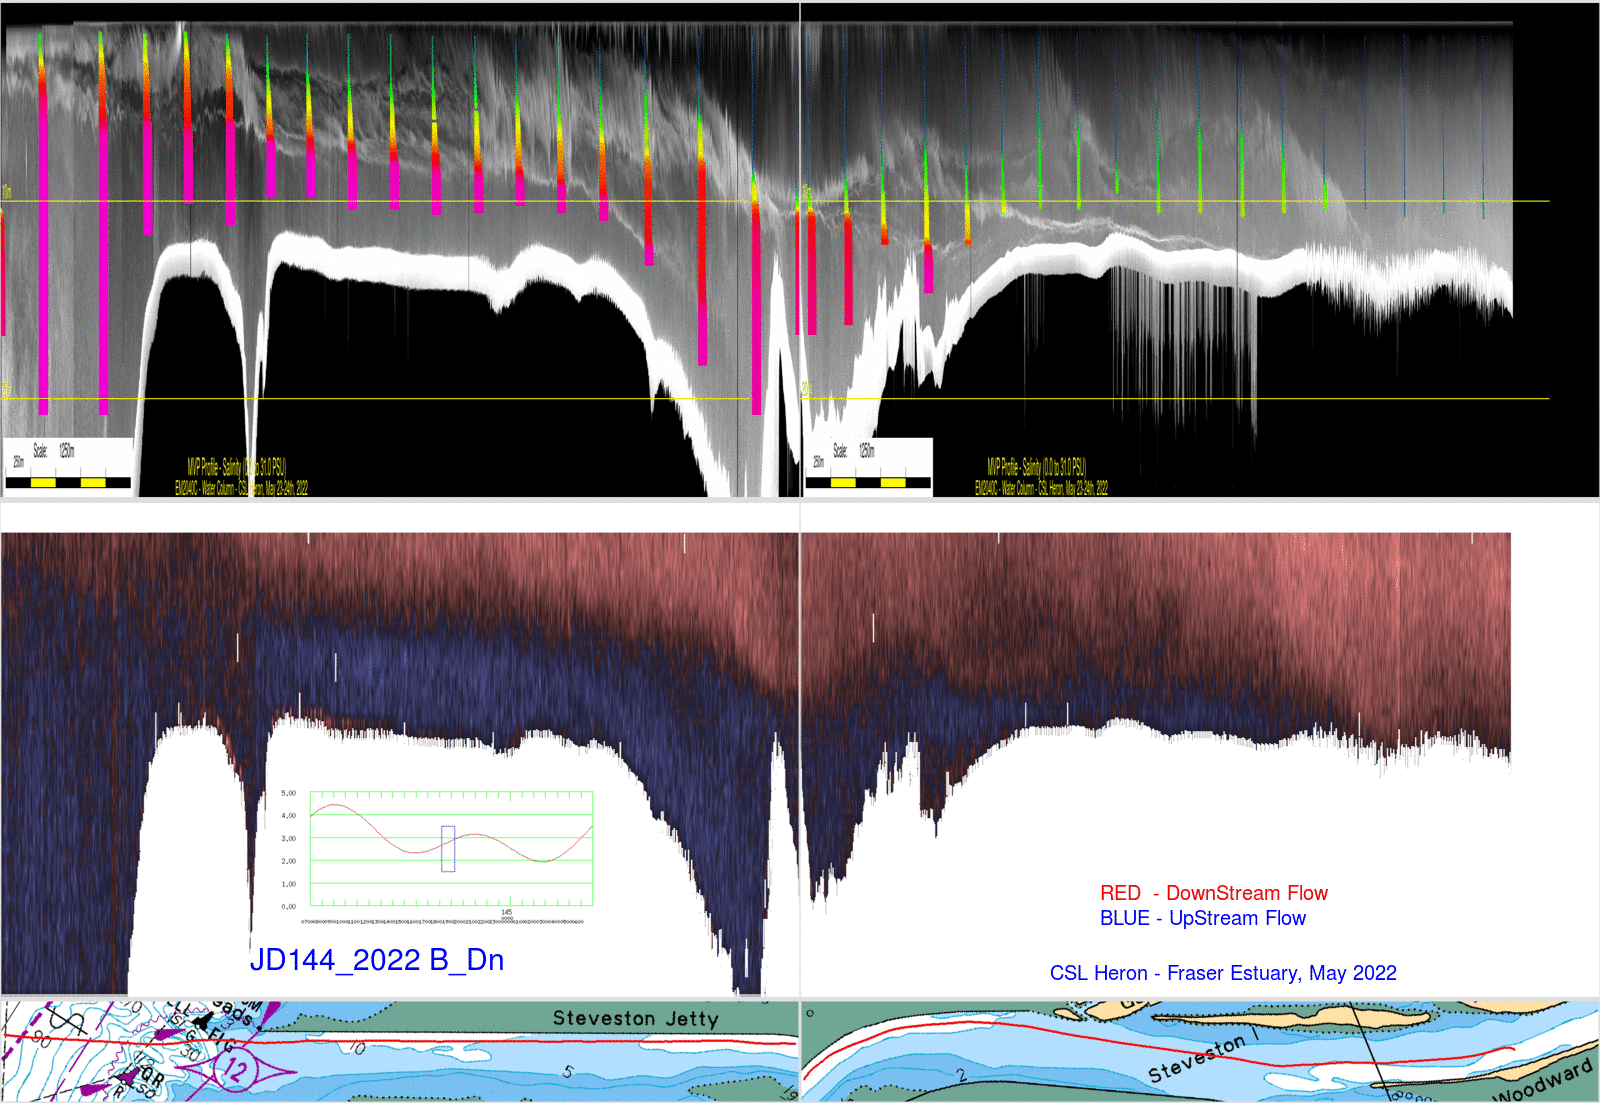
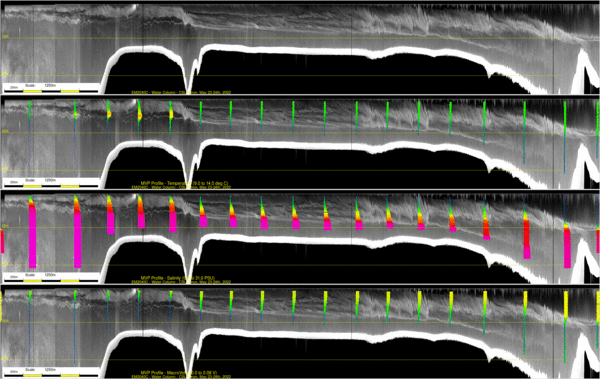
| May 24th (JD 144) 2022 -
Section B (steaming downstream) |
|
| Comments: - Weak late flood tide - salt wedge inflowing and past bend extending half way up Steveston Reach. |
|
 |
|
| Detailed Sections - click for
2.5m alongtrack resolution EM2040 WCD and MVP Temperature, Salinity and Optical Backscatter Overprinted. |
|
 |
 |
| all mvp dips in line | |
| May 24th (JD 144) 2022 -
Section C (steaming upstream) |
|
| Comments: - lower high water - maximum observed penetration of salt wedge. Inflowing salt layer of similar speed as outflowing surface waters. |
|
 |
|
| Detailed Sections - click for
2.5m alongtrack resolution EM2040 WCD and MVP Temperature, Salinity and Optical Backscatter Overprinted. |
|
 |
 |
| all mvp dips in line | |
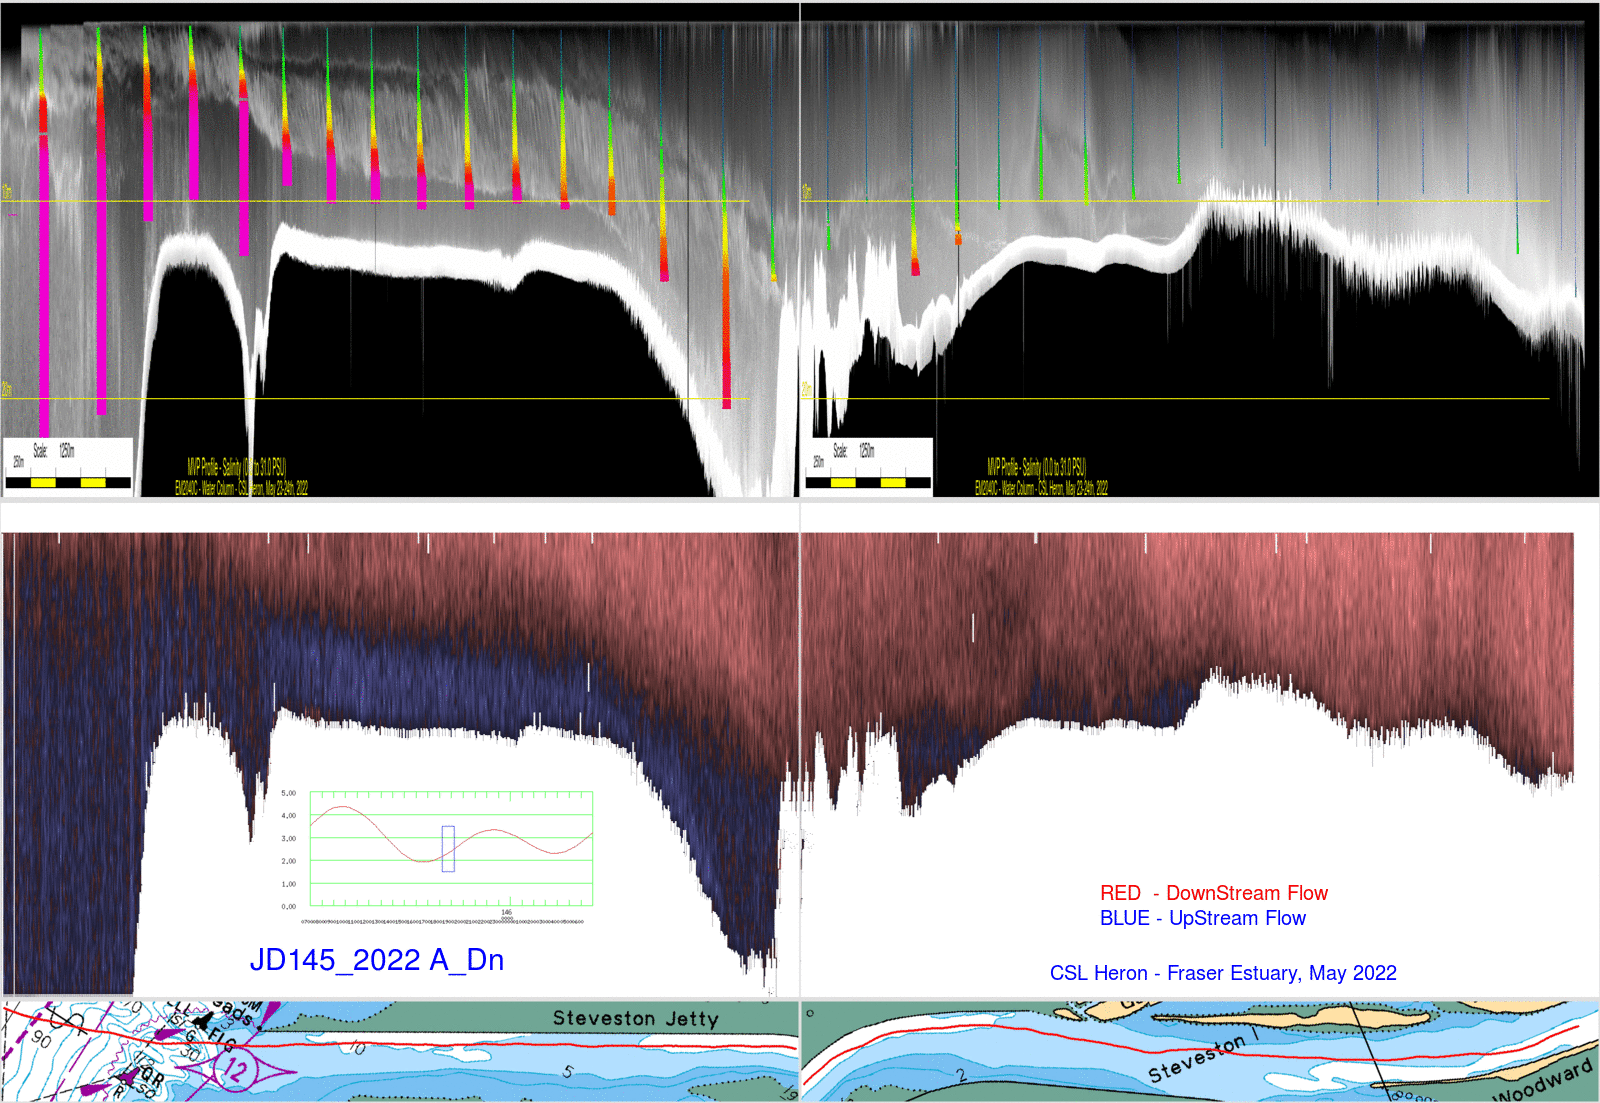
| May 25th (JD 145) 2022 -
Section A (steaming downstream) |
|
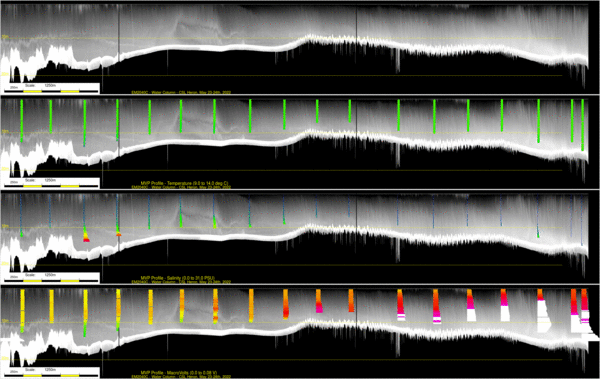
| Comments: - Just after a weak low water. Salt wedge is almost all downstream of the bend. Note the remarkably murky conditions close to the seabed upstream of the salt wedge, implying entrainment of river bed sediment once the river shear can interact directly with the bottom. |
|
 |
|
| Detailed Sections - click for
2.5m alongtrack resolution EM2040 WCD and MVP Temperature, Salinity and Optical Backscatter Overprinted. |
|
 |
 |
| all mvp dips in line | |
| # |
lat/lon deg/min/sec |
decimal lat/lon |
depth (m) |
closest MVP dips |
comments |
| 1 |
49 06 40.4899 N -123 -17 -01.9928 W | 49.111247 -123.283887 | 1 |
250 252 |
|
| 2 |
49 06 32.2498
N -123 -17 -31.8306 W |
49.108958 -123.292175 | 5 |
247 248 |
|
| 3 |
49 06 34.4135
N -123 -17 -10.8881 W |
49.109559 -123.286358 | 8 |
249 251 |
| # |
lat/lon deg/min/sec |
decimal lat/lon |
depth (m) |
closest MVP dips |
comments |
| 4 |
49 07 24.8307 -N -123
-15 -10.7057 W |
49.123564 -123.252974 | 2 |
263 266 |
|
| 5 |
49 07 22.4391 N -123 -15
-19.2473 W |
49.122900 -123.255346 | 7 |
263 265 |
|
| 6 |
49 07 20.0058 N -123 -15
-29.4972 W |
49.122224 -123.258194 | 11 |
262 264 |
| # |
lat/lon deg/min/sec |
decimal lat/lon |
depth (m) |
closest MVP dips |
comments |
| 7 |
49 07 01.7967 N -123 -11
-17.3246 W |
49.117166 -123.188146 | 2 |
287 286 |
|
| 8 |
49 07 03.7465 N -123 -11
-22.3182 W |
49.117707 -123.189533 | 6 |
286 287 |
|
| 9 |
49 07 06.9151 N -123 -11
-30.4765 W |
49.118588 -123.191799 | 11 |
285 286 |