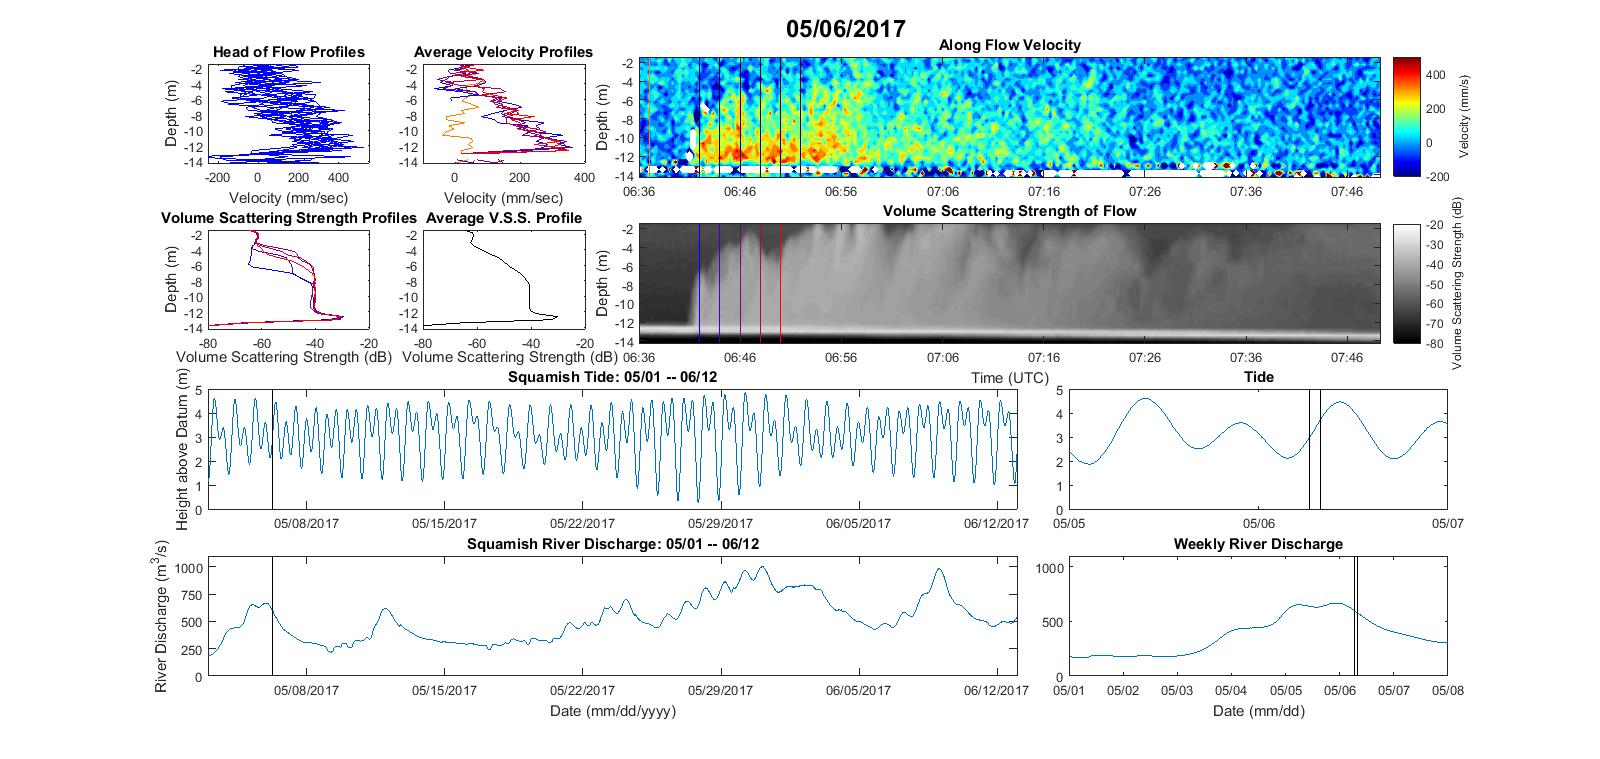
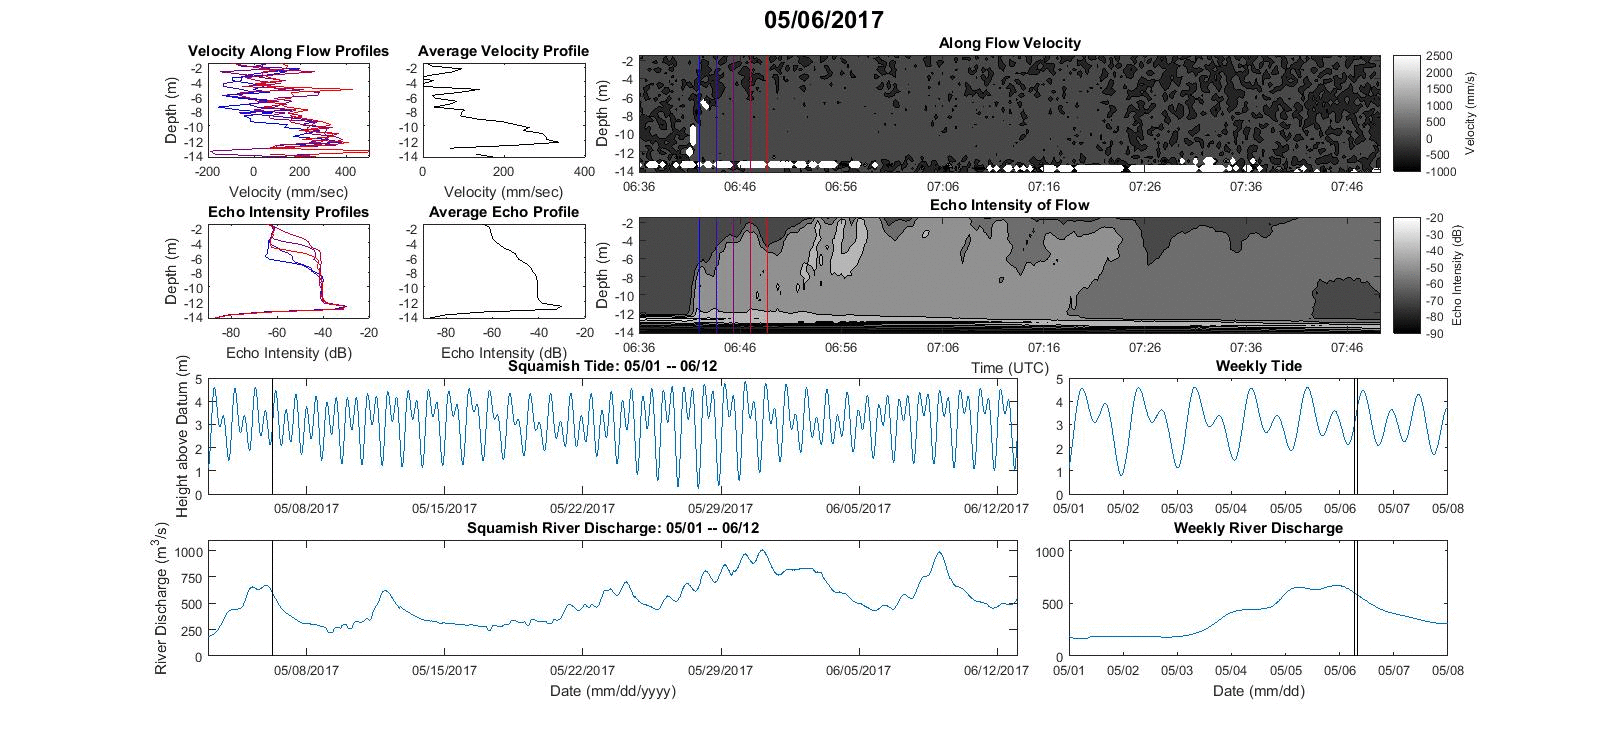
6th May
Peak ~ 0.3m/s
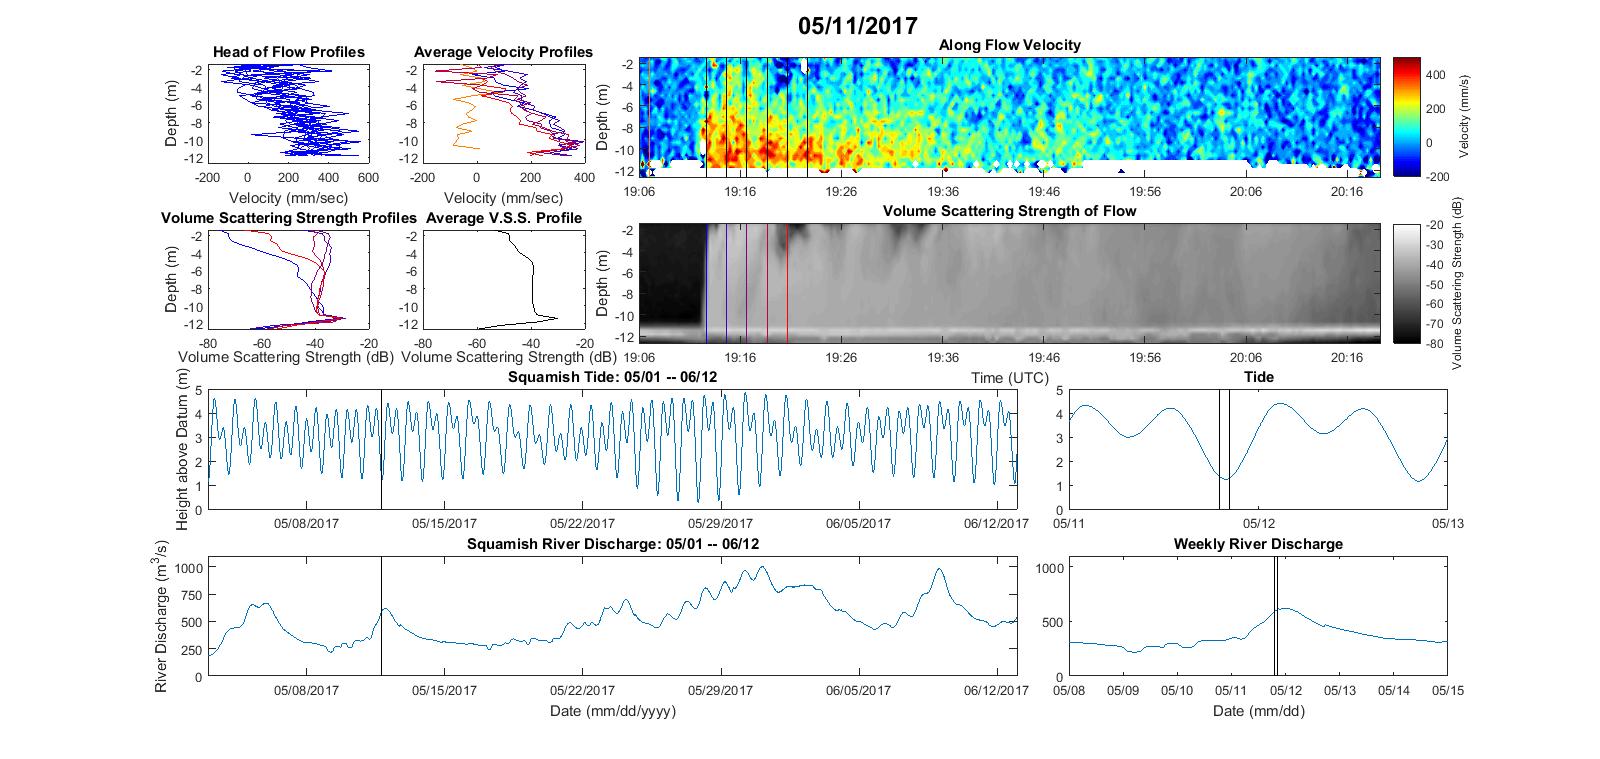
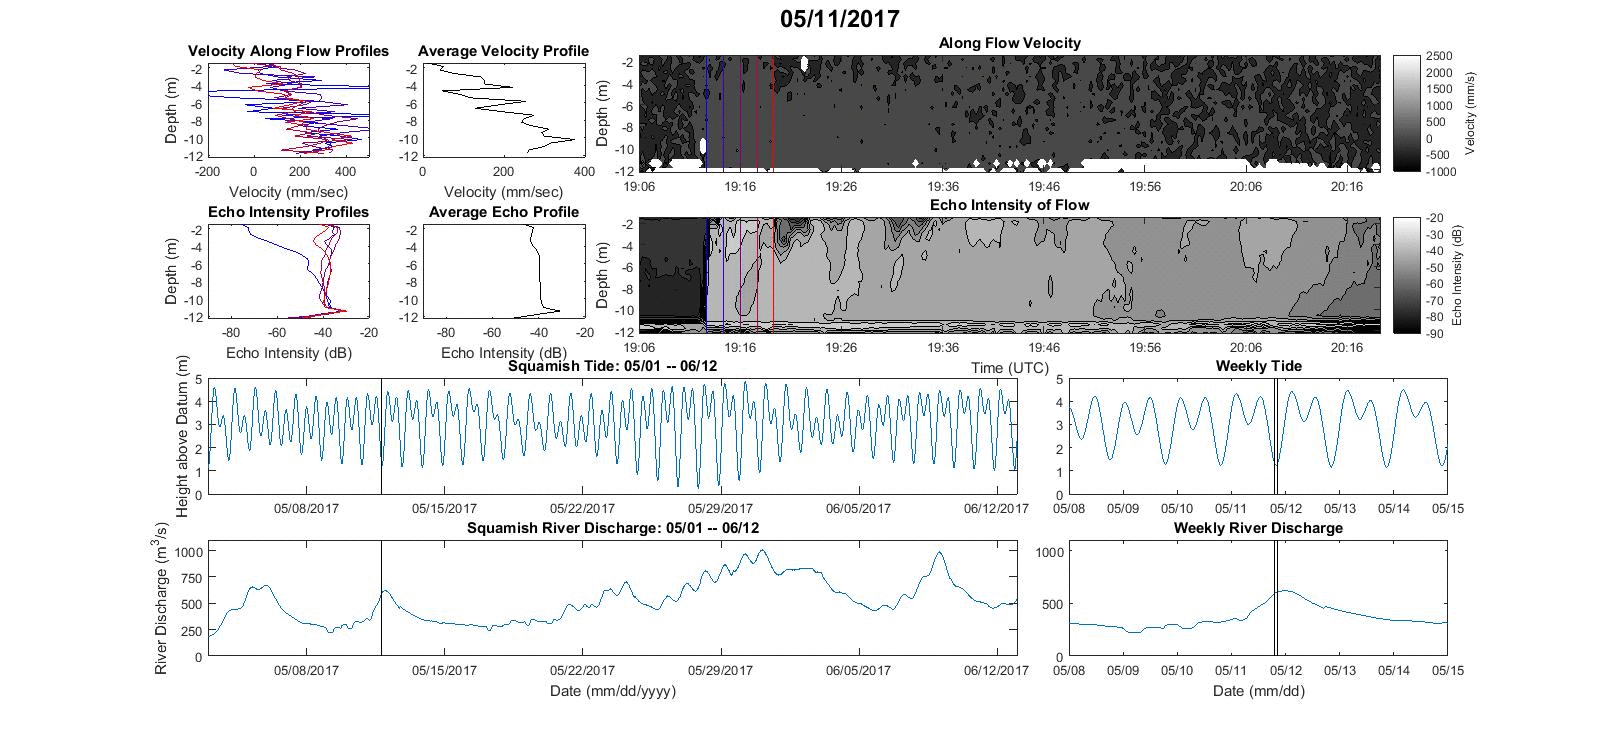
11th May
Peak ~ 0.3m/s
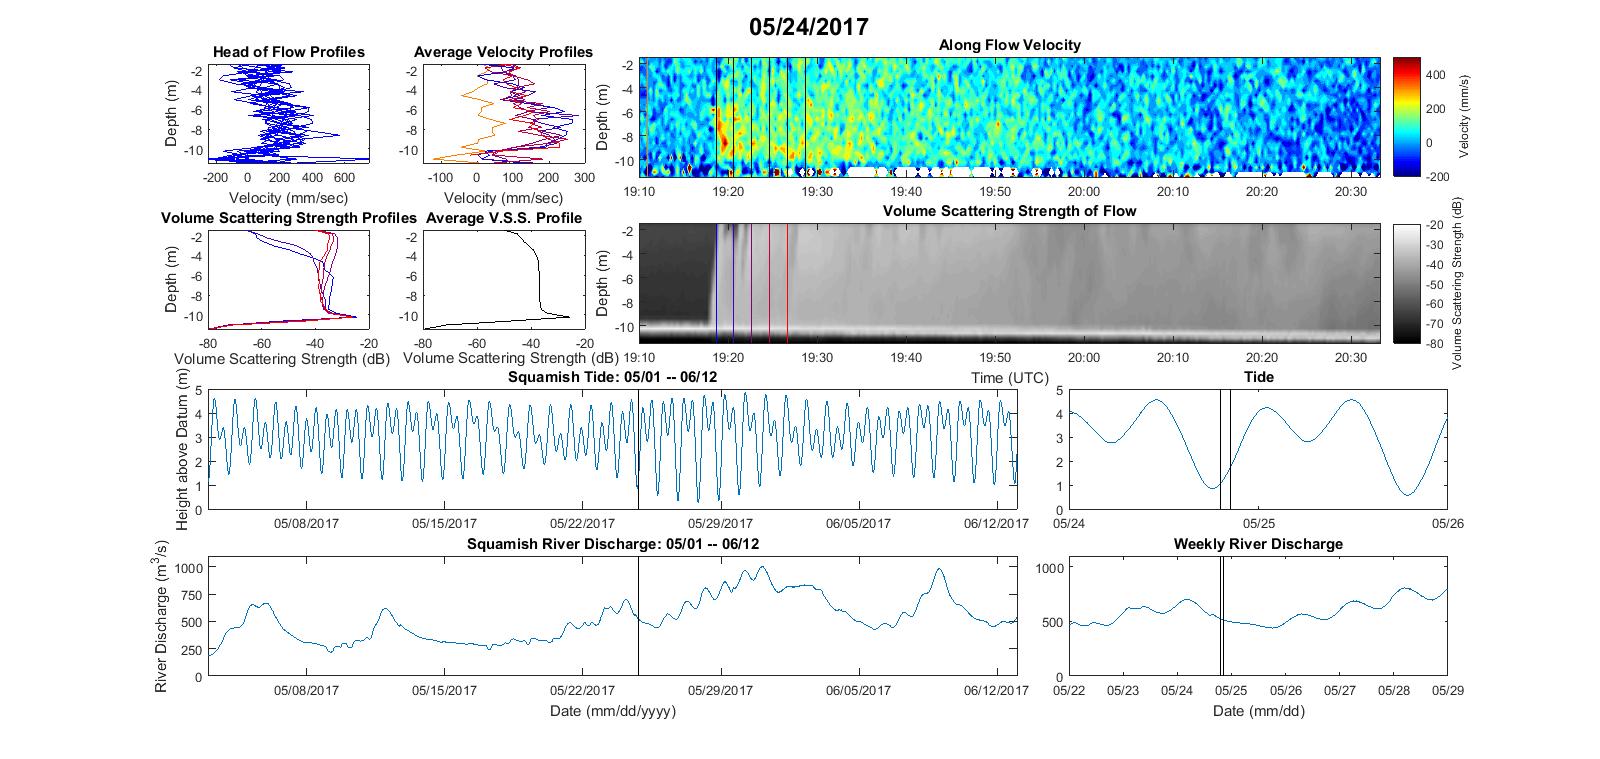
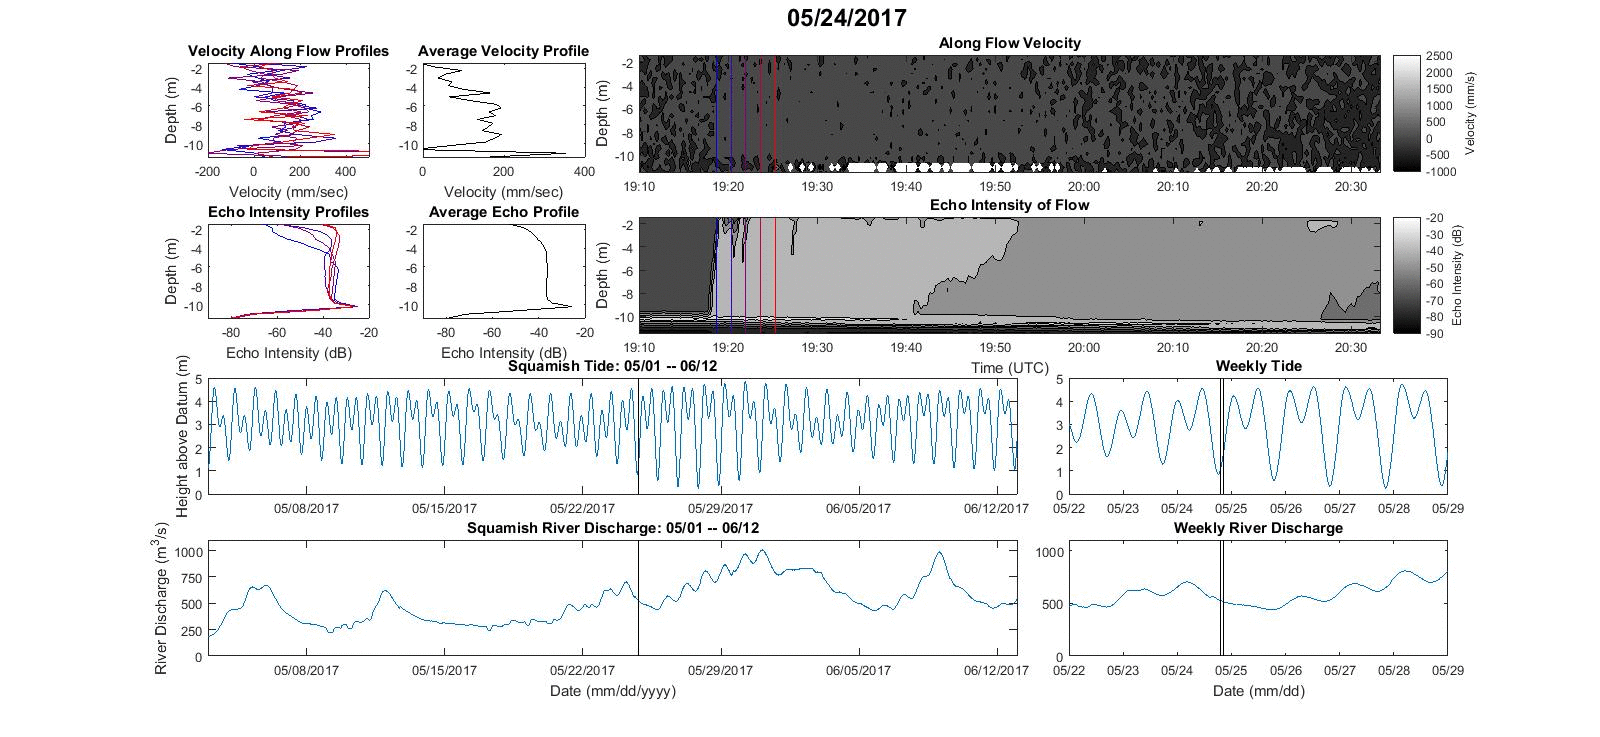
24th May
Peak ~ 0.2m/s
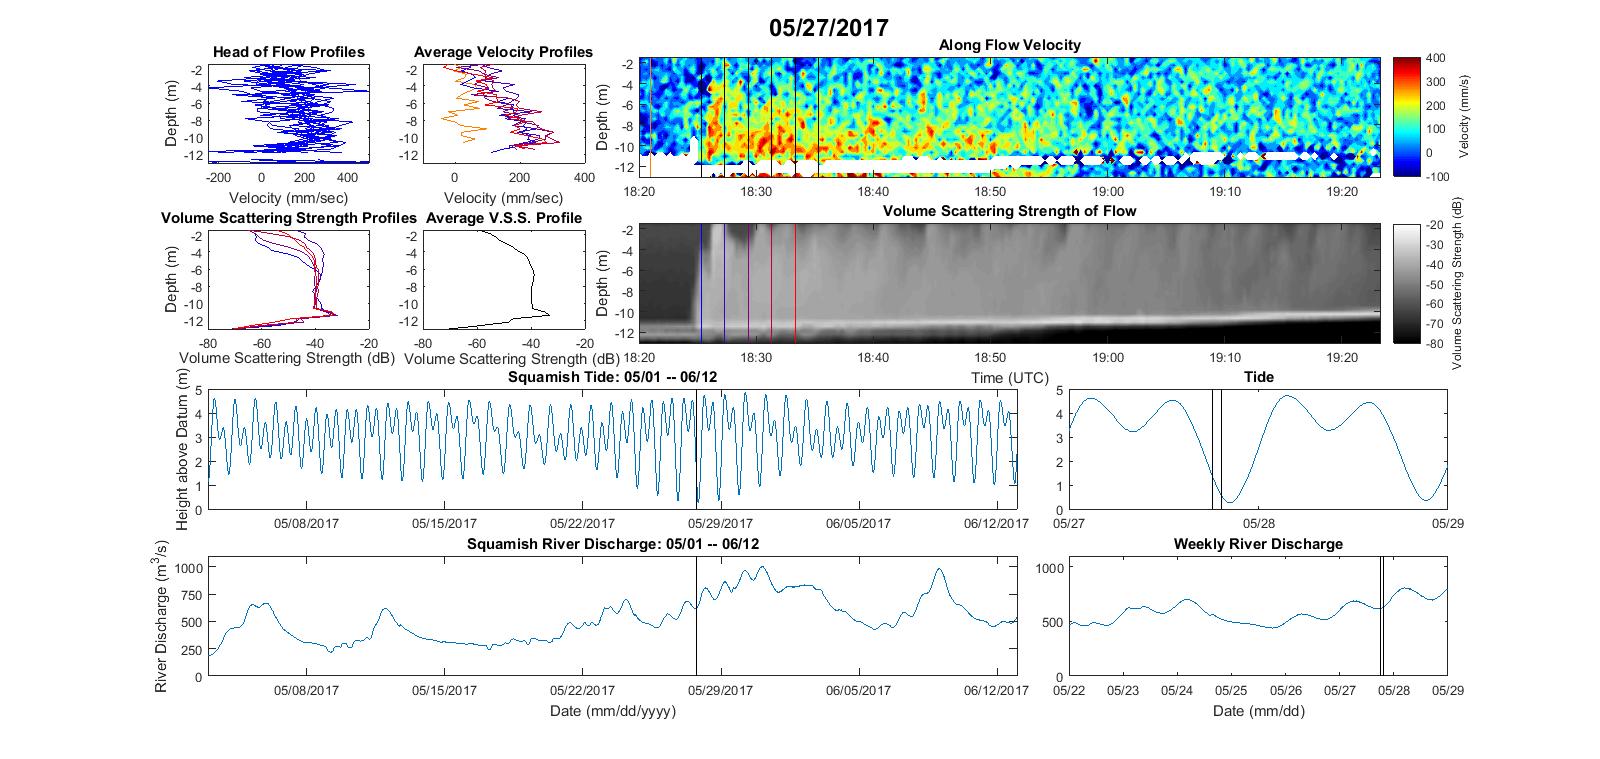
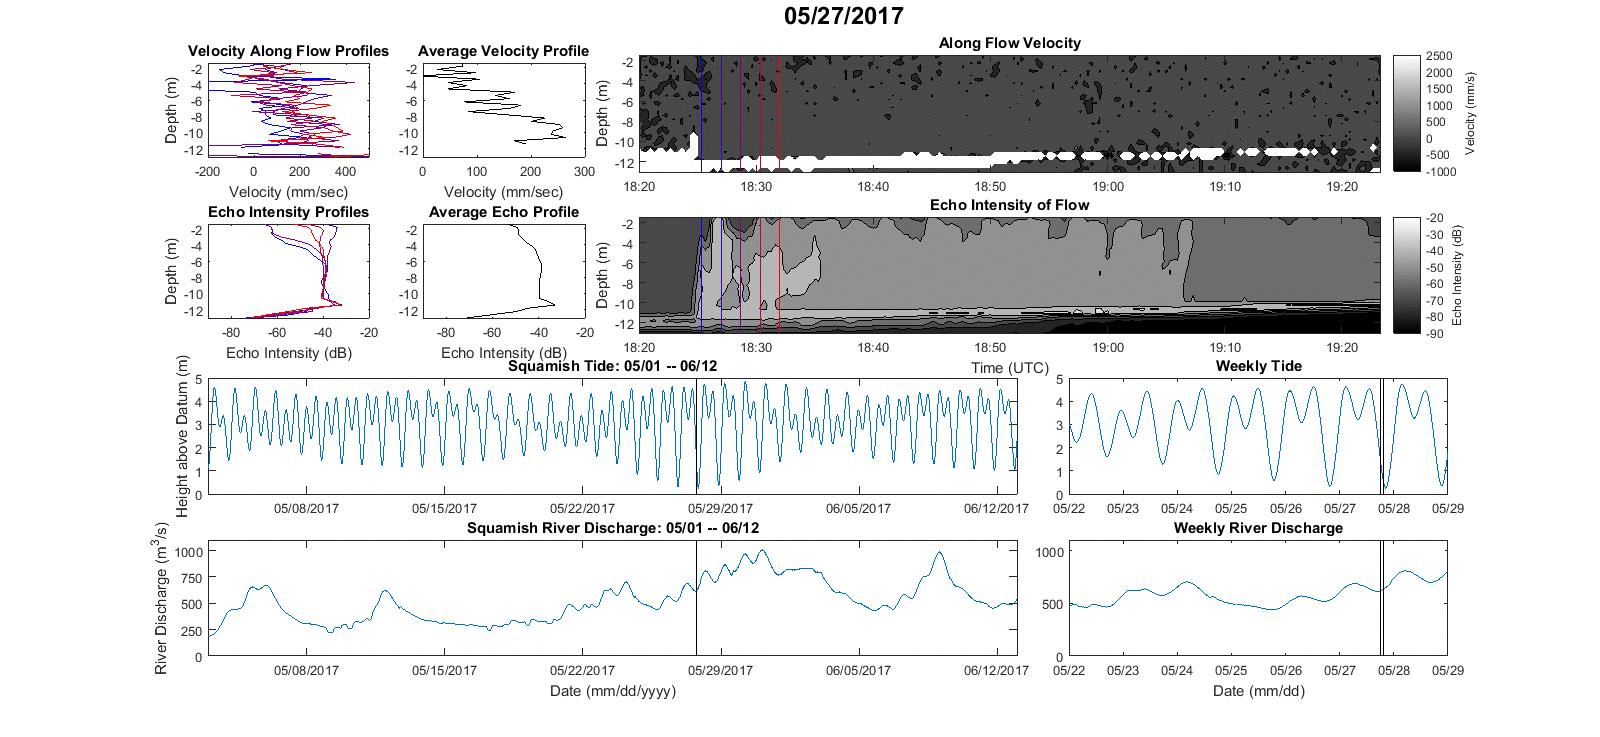
27th May
Peak ~ 0.25m/s
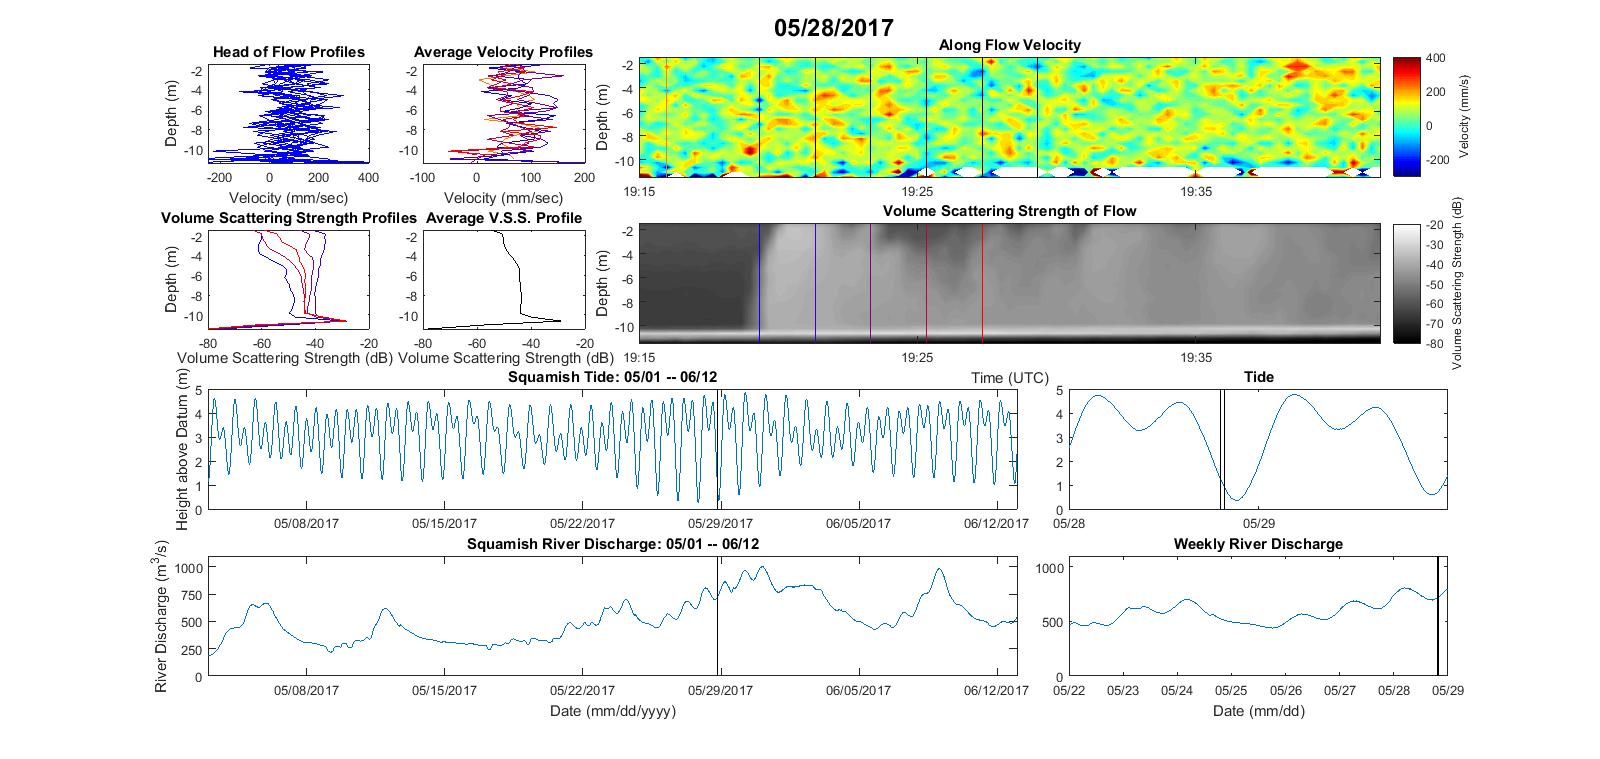
28th May
Peak ~ 0.1m/s
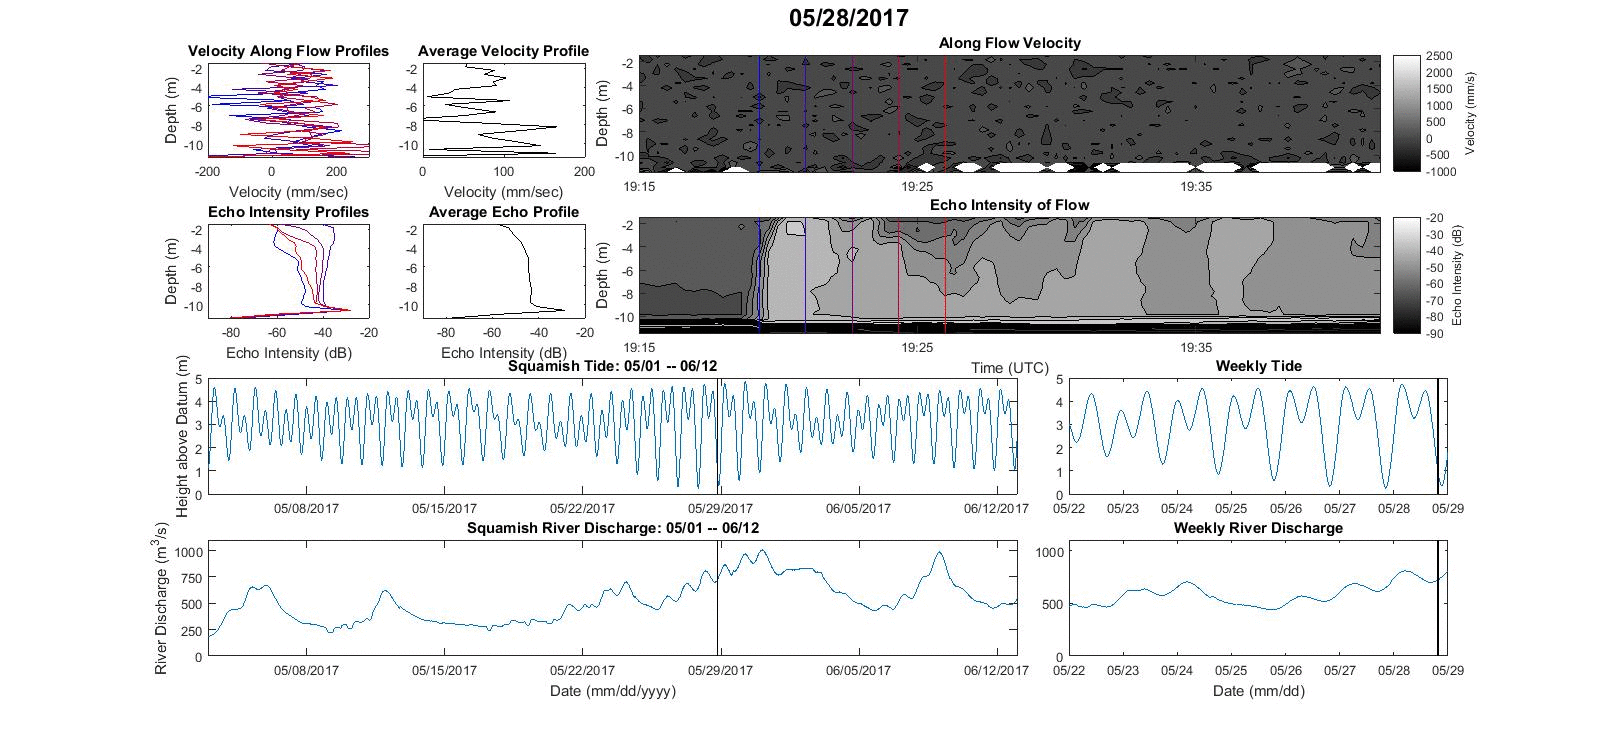
The next three flows (150 - A, B C) all
occurred within the same low water period within ~ 1.5
hours.
(followed by another very weak one 3.5 hours after the first)
(followed by another very weak one 3.5 hours after the first)
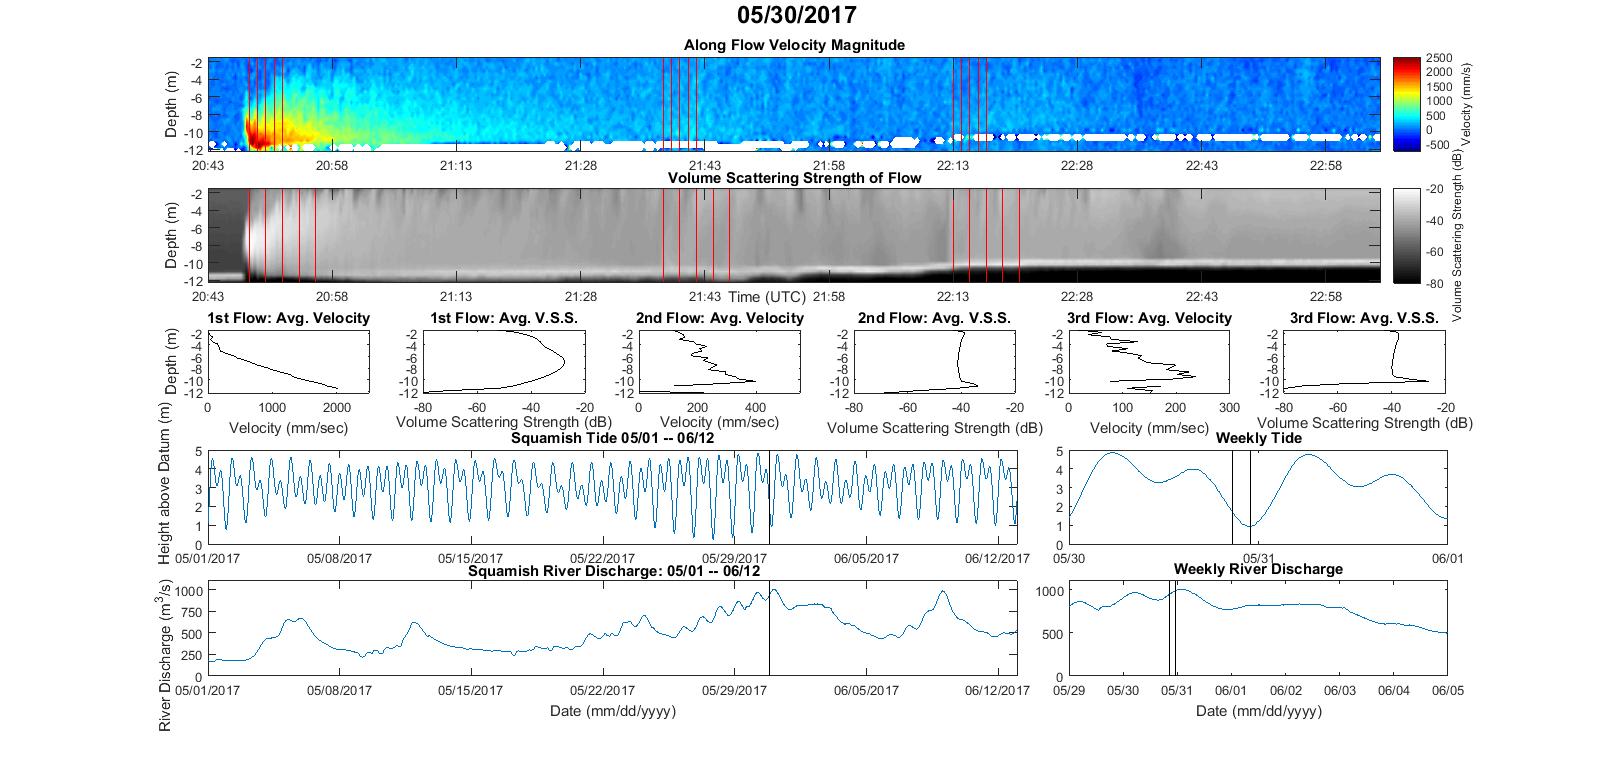
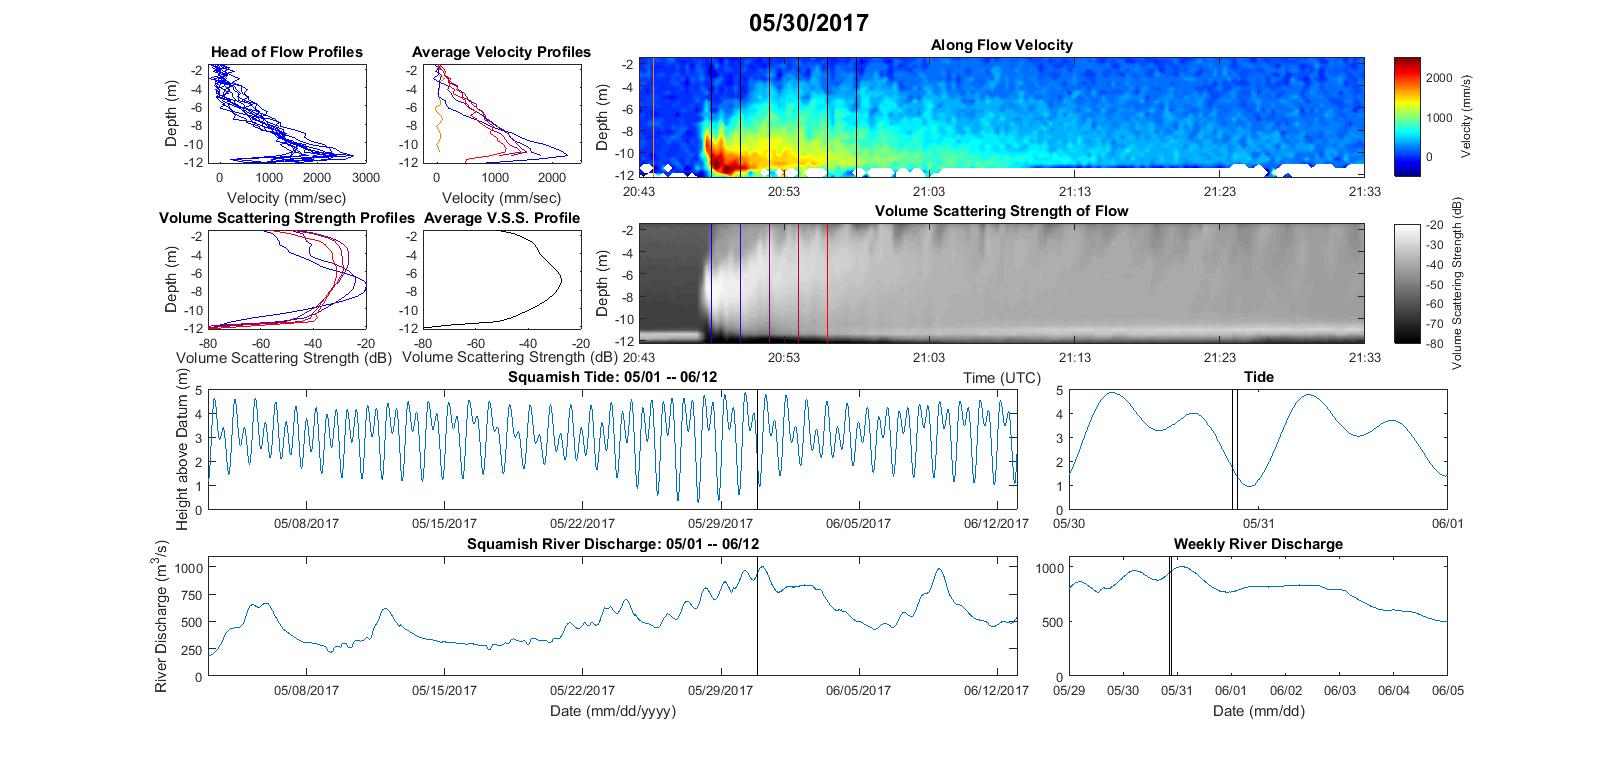
30th May
Peak - 2.2m/s
ACTUALLY up to 3.5 m/s!
The first major one of the year
- 2048 - first of day...
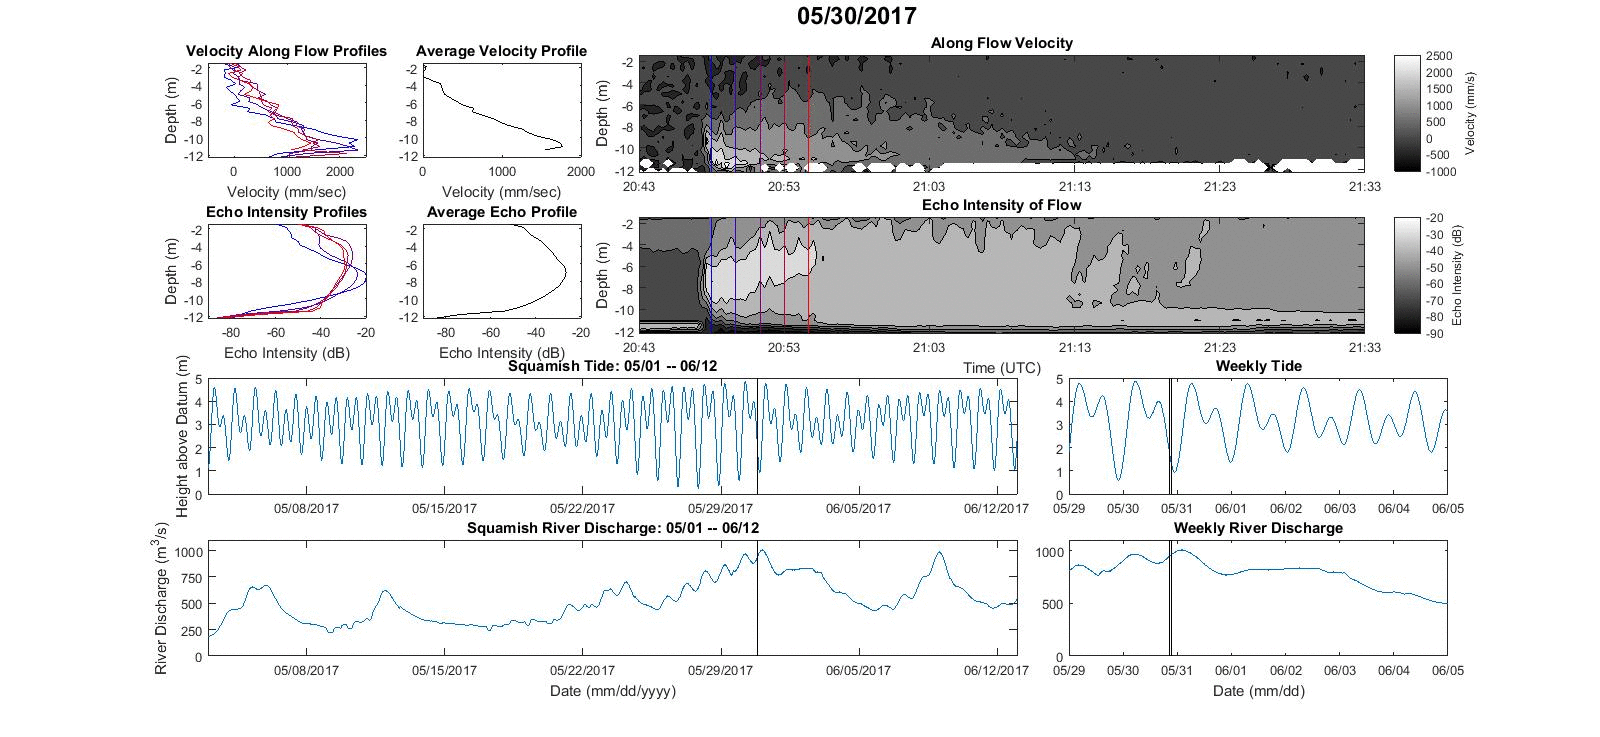
30th May
Peak ~ 0.6m/s
- 2135 - (47 minutes later)
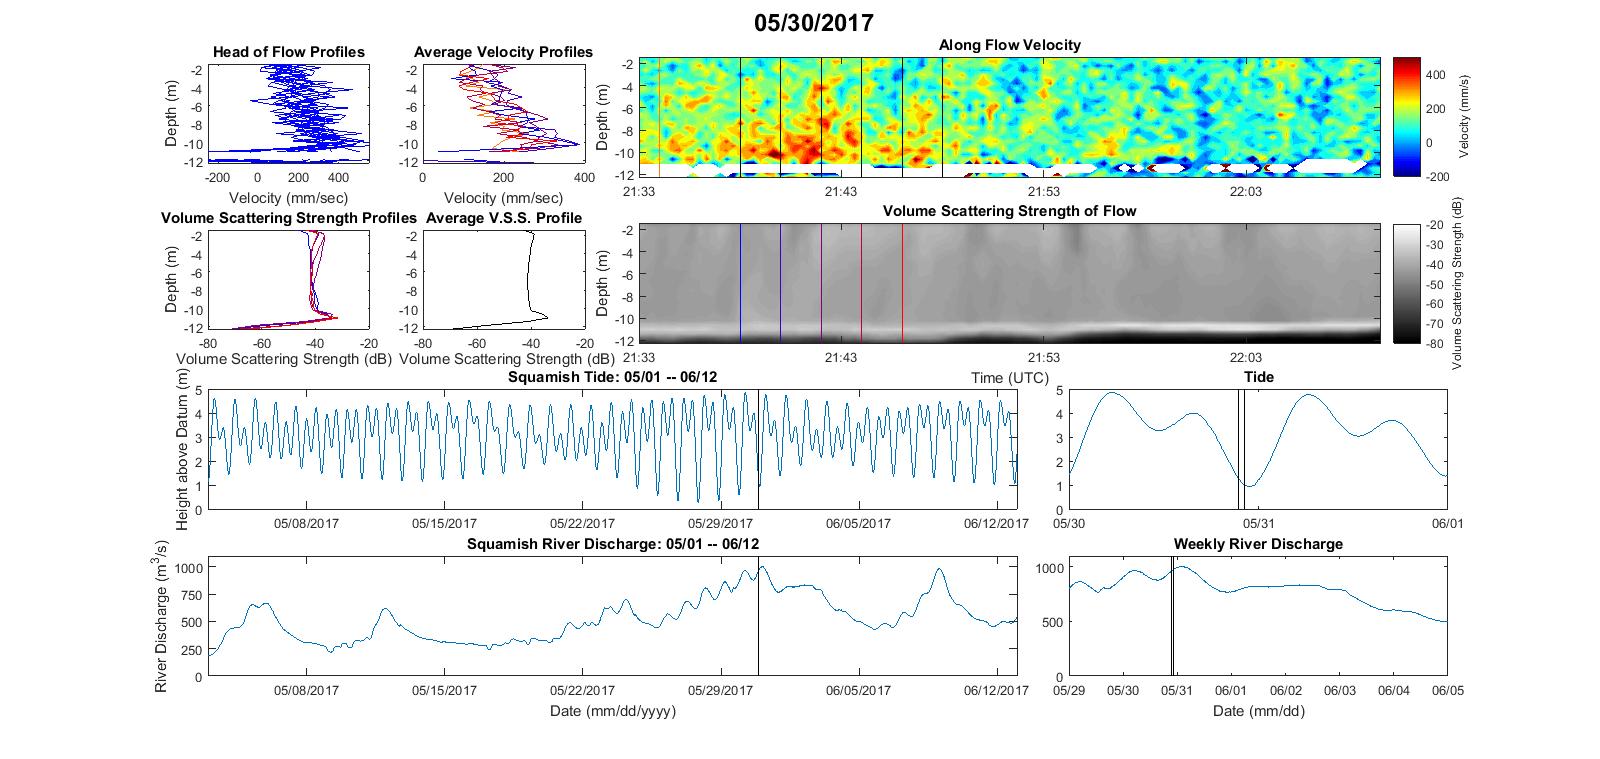
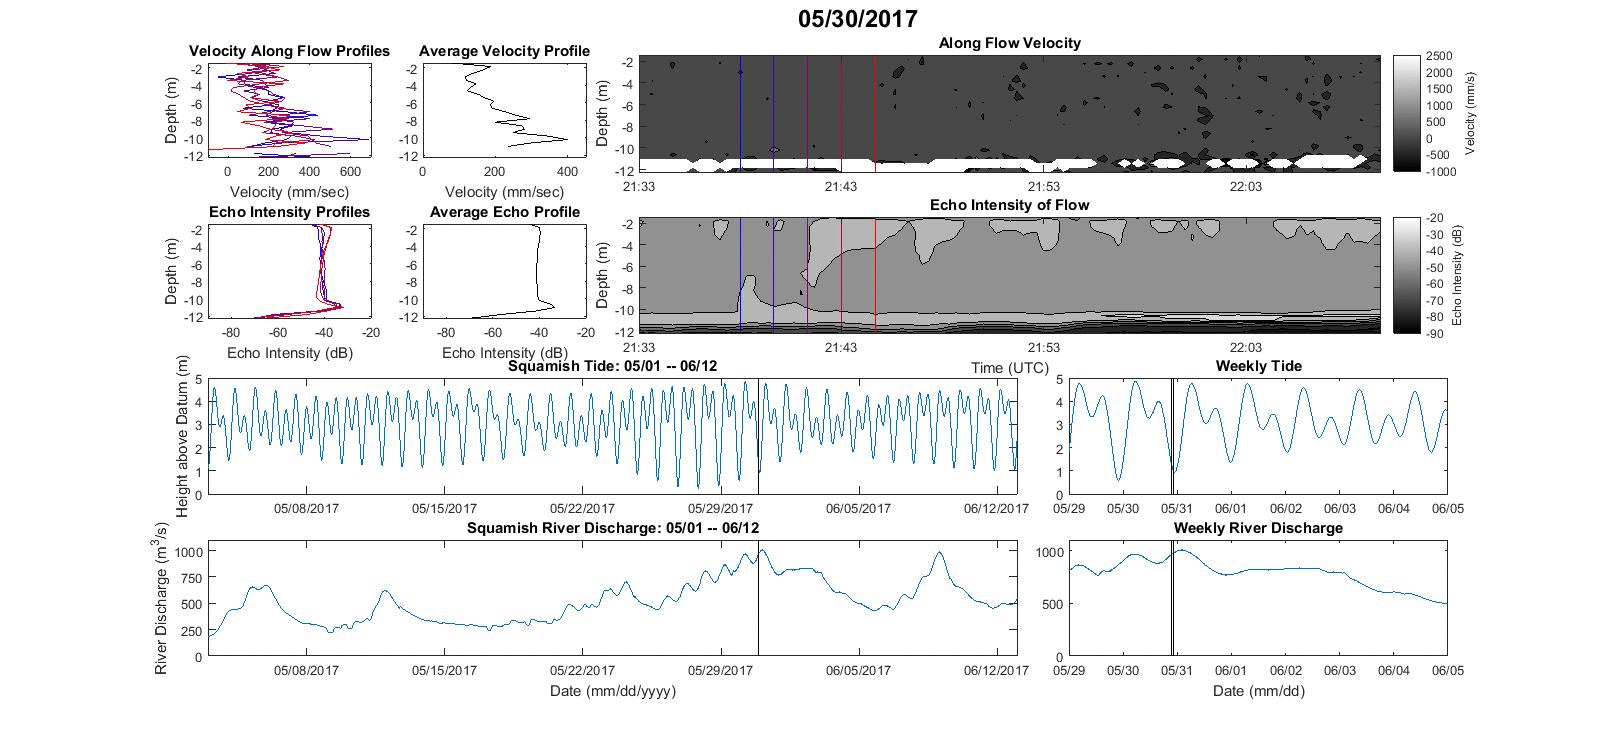
30th May
Peak ~ 0.3m/s
- 2213 - (38 minutes later)
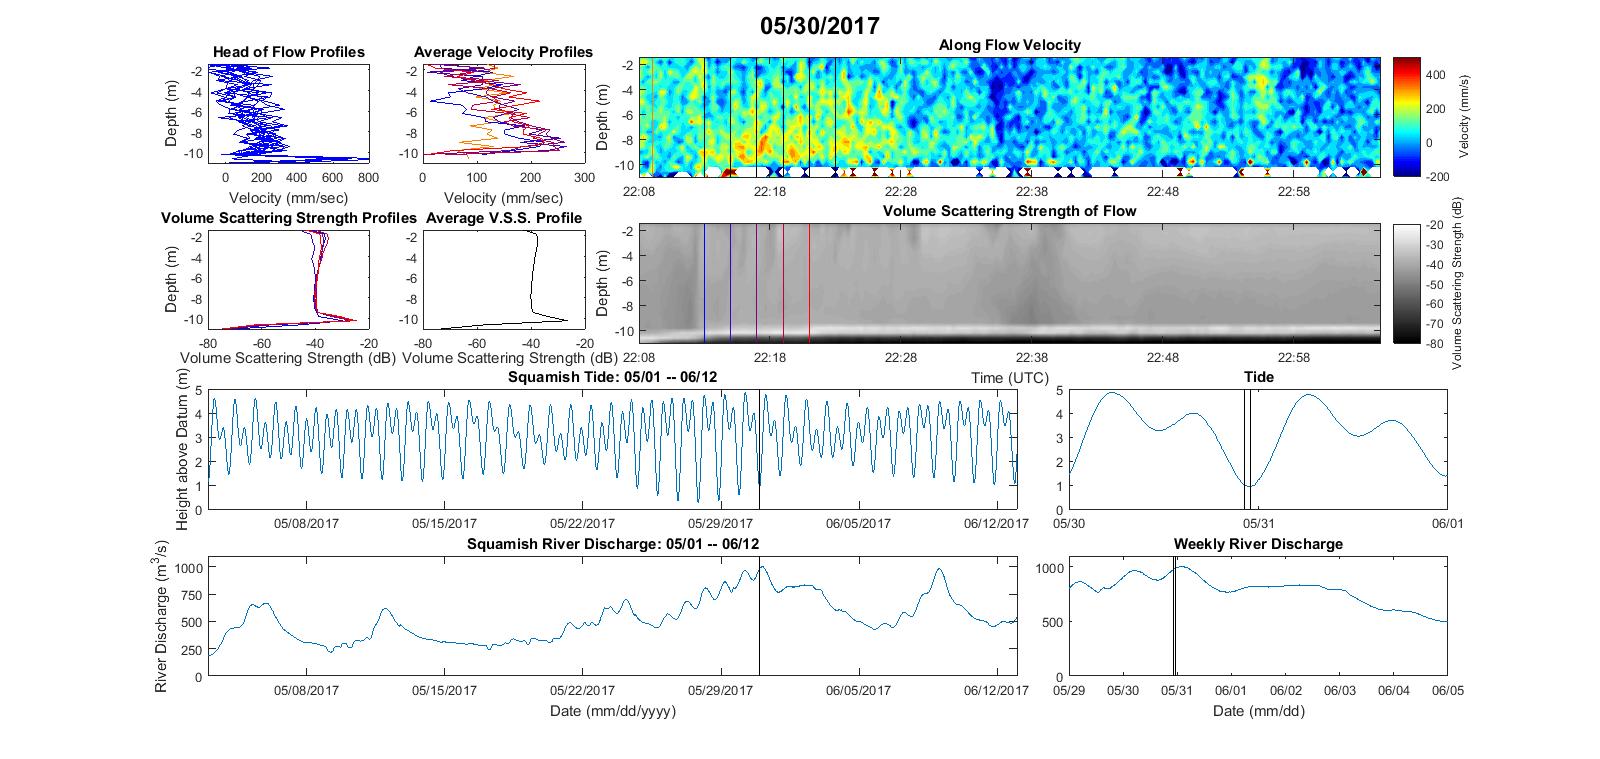
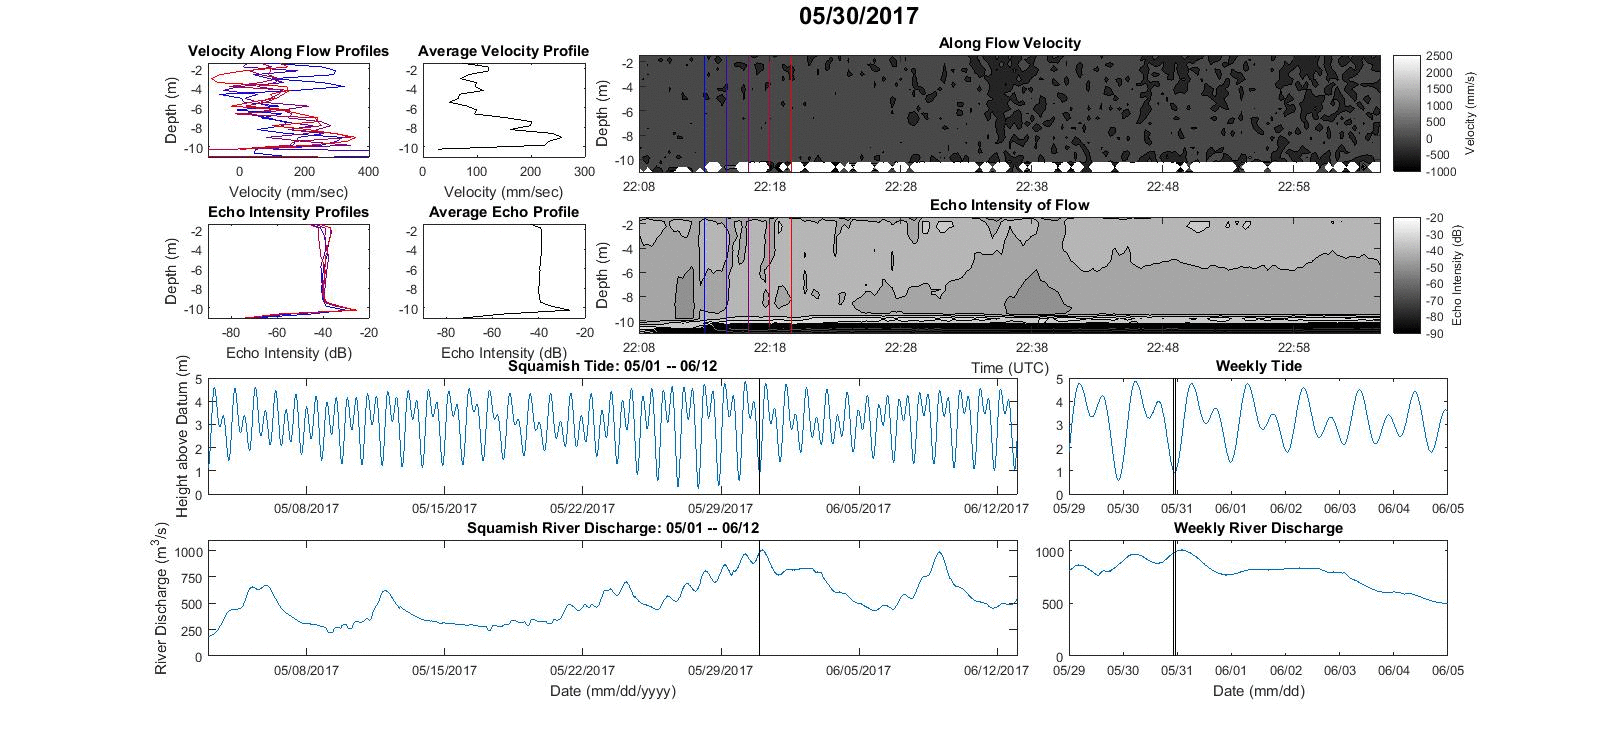
31st May
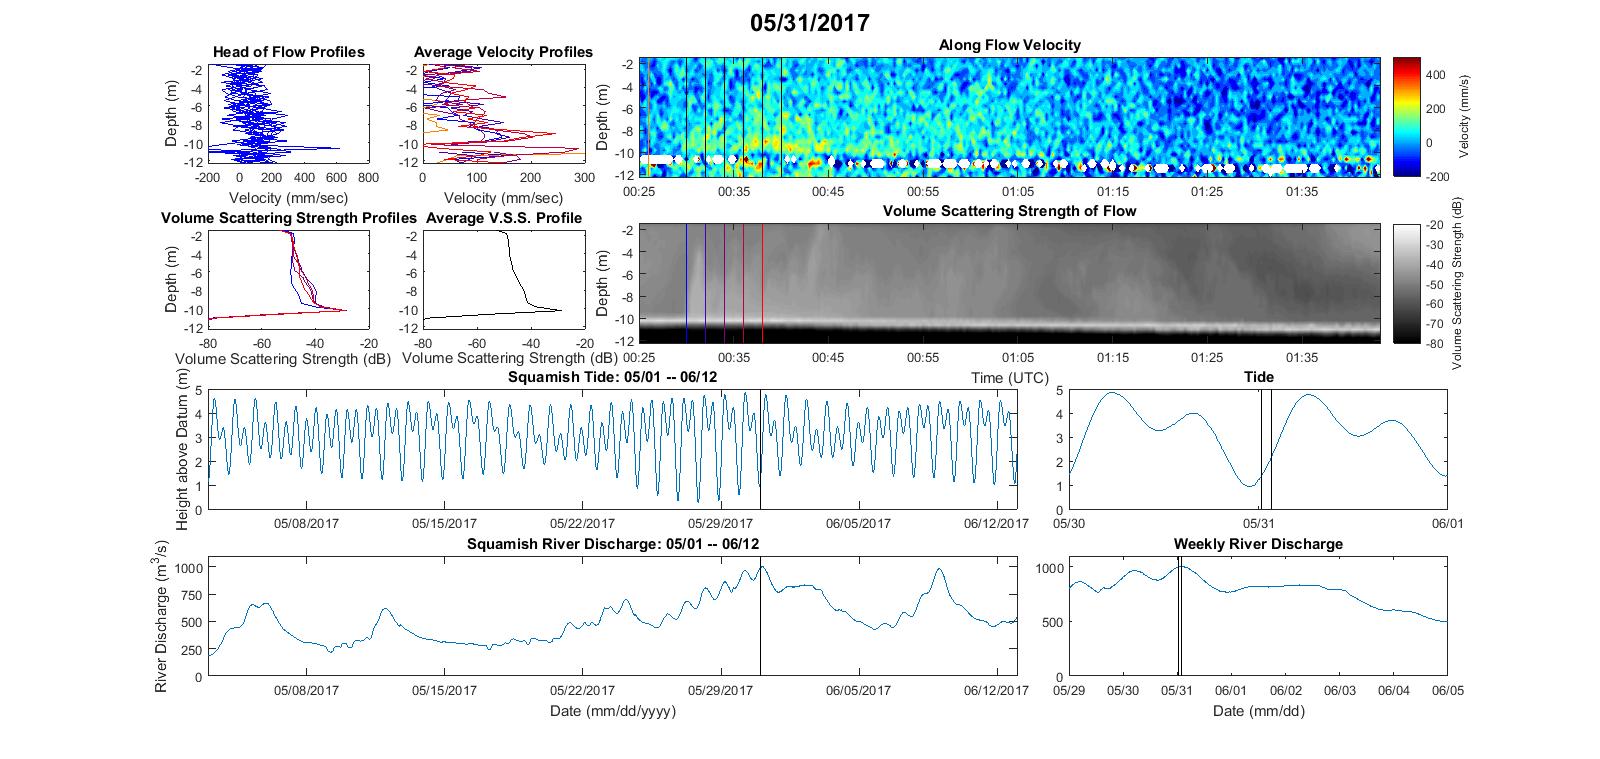
1st June
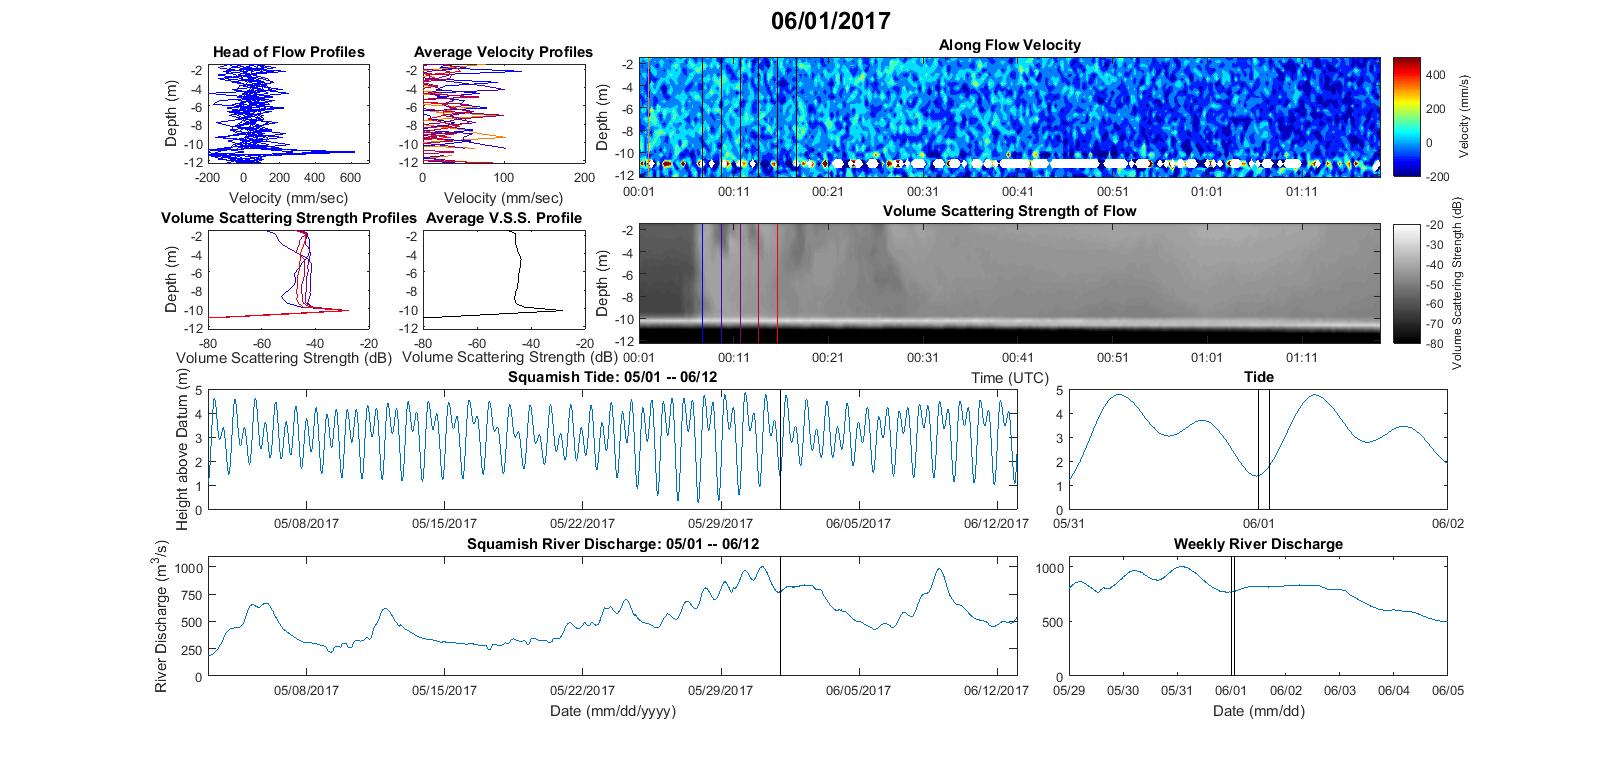
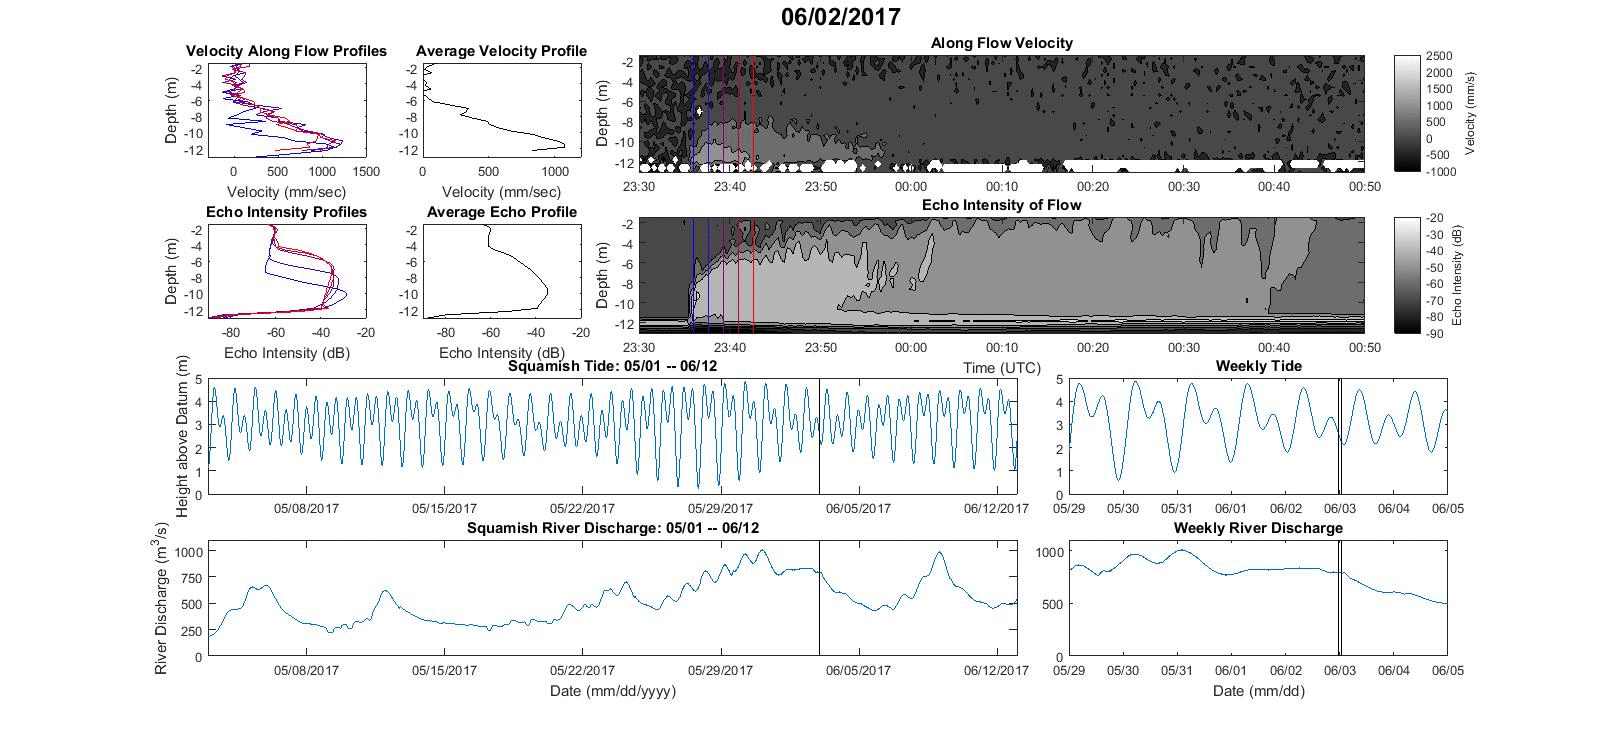
2nd June
Peak ~ 1.3m/s
ACTUALLY up to 1.8 m/s!
- 2235
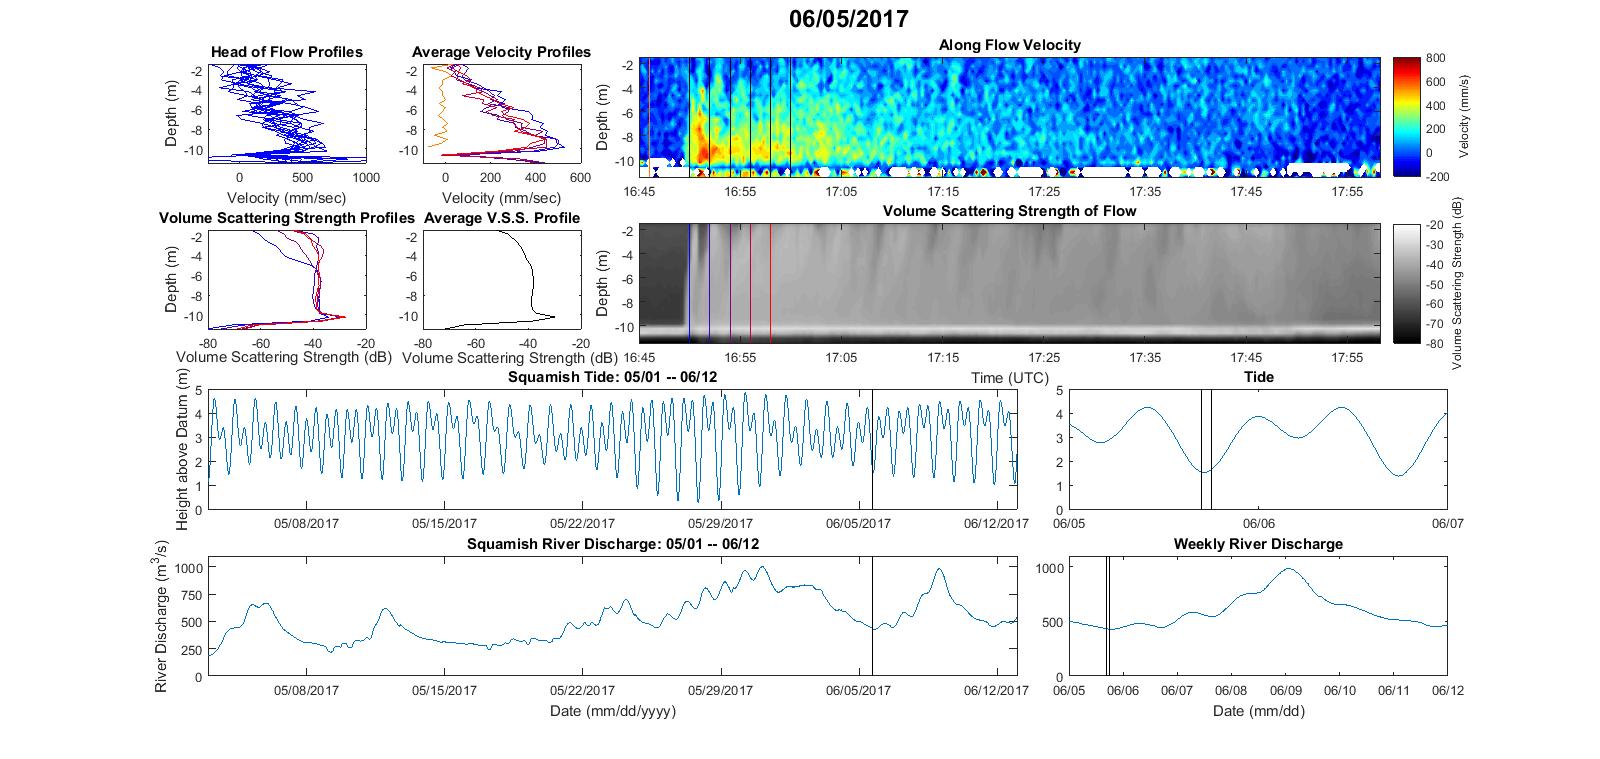
5th June
Peak ~ 0.7m/s
neither a river surge (actually a drop) nor a spring LW.
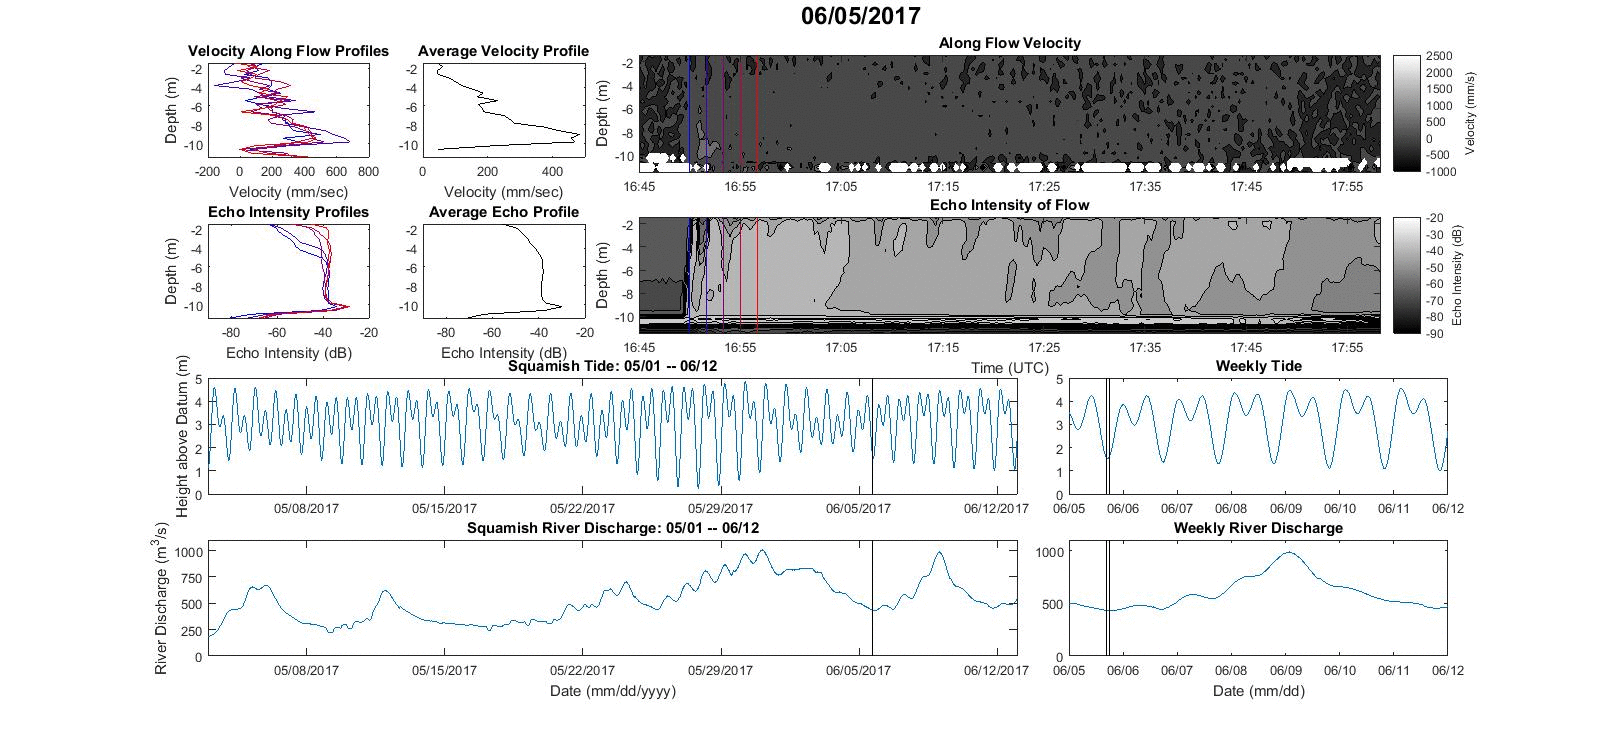
The next two flows (JD158 A and B)
occurred within the same low water period within a half
hour.
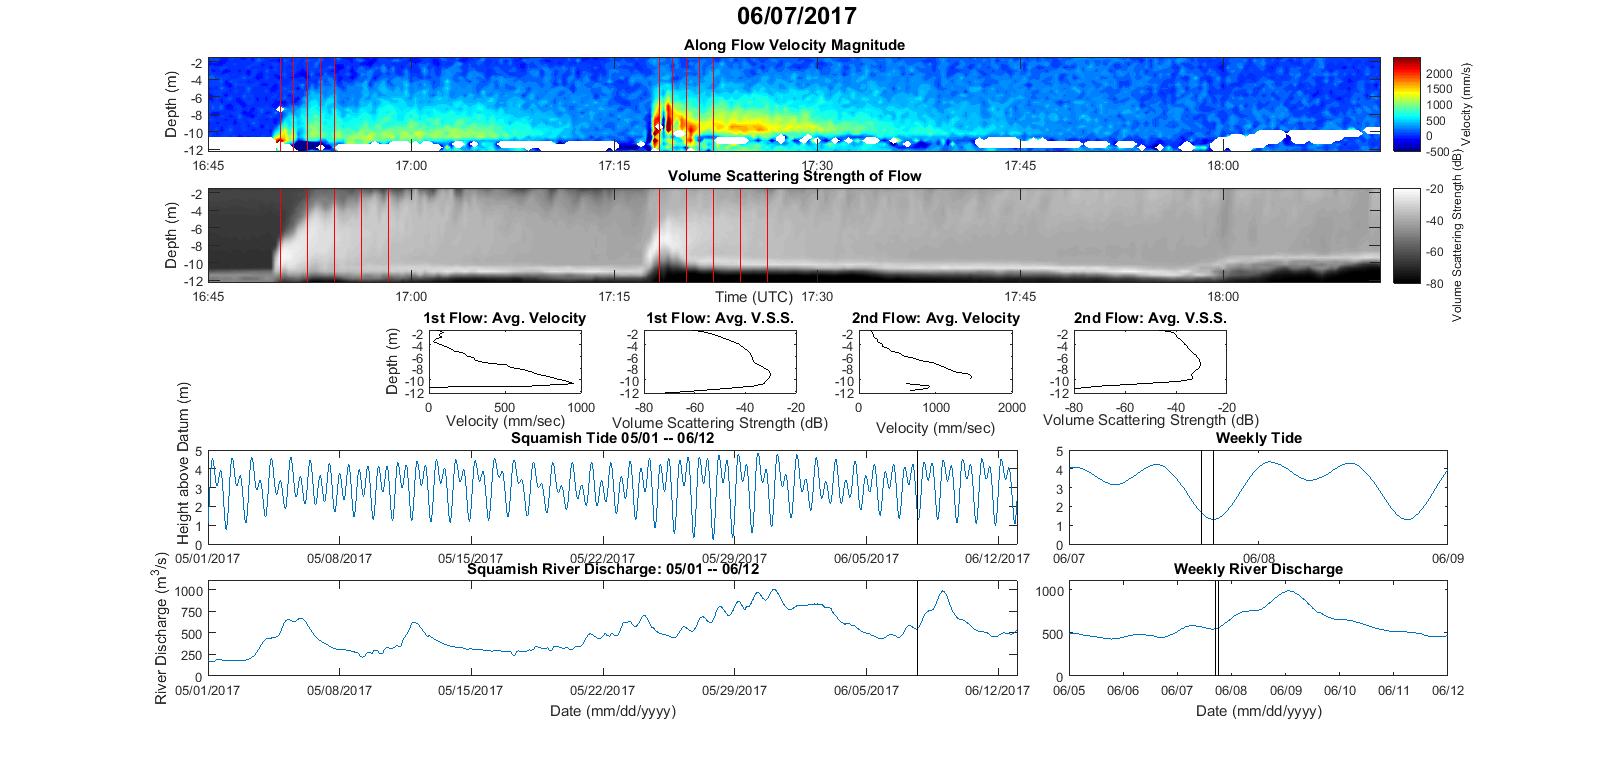
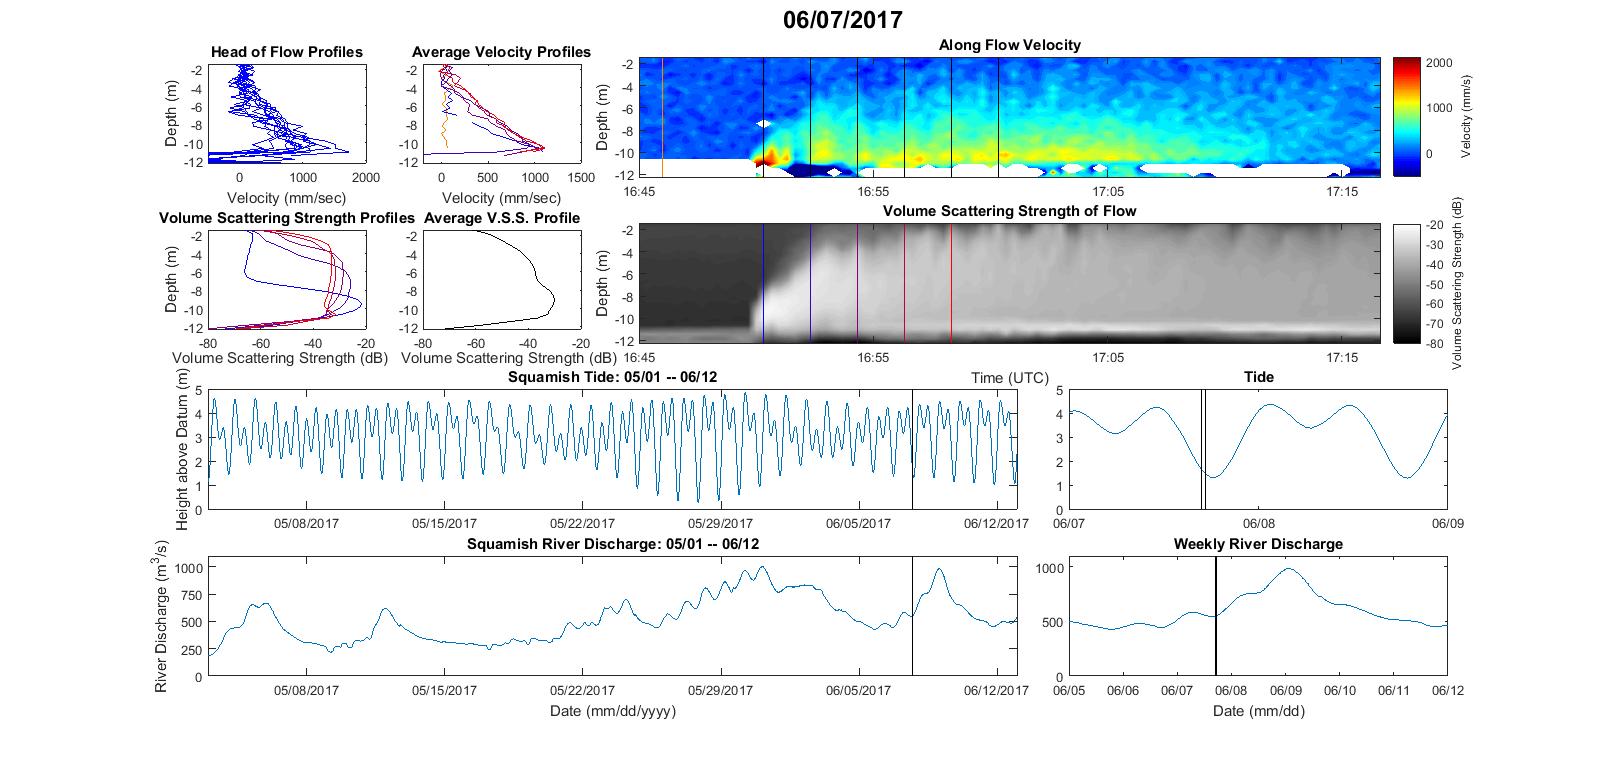
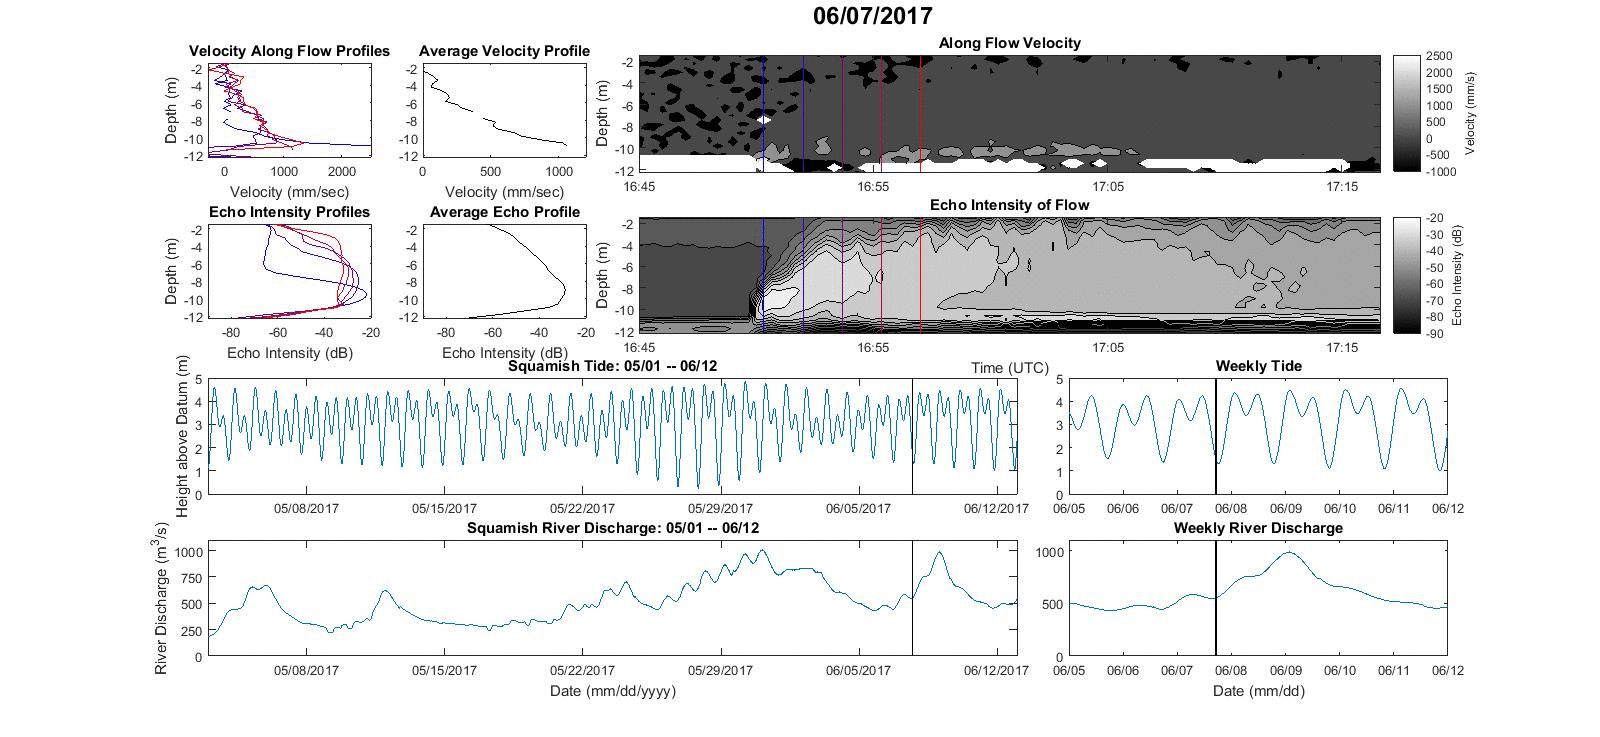
7th June
Peak ~ 1.3m/s
ACTUALLY sustained at 1.8m/s
peaking (if you believe it) to 3.0m/s
- 1650 - first of day...
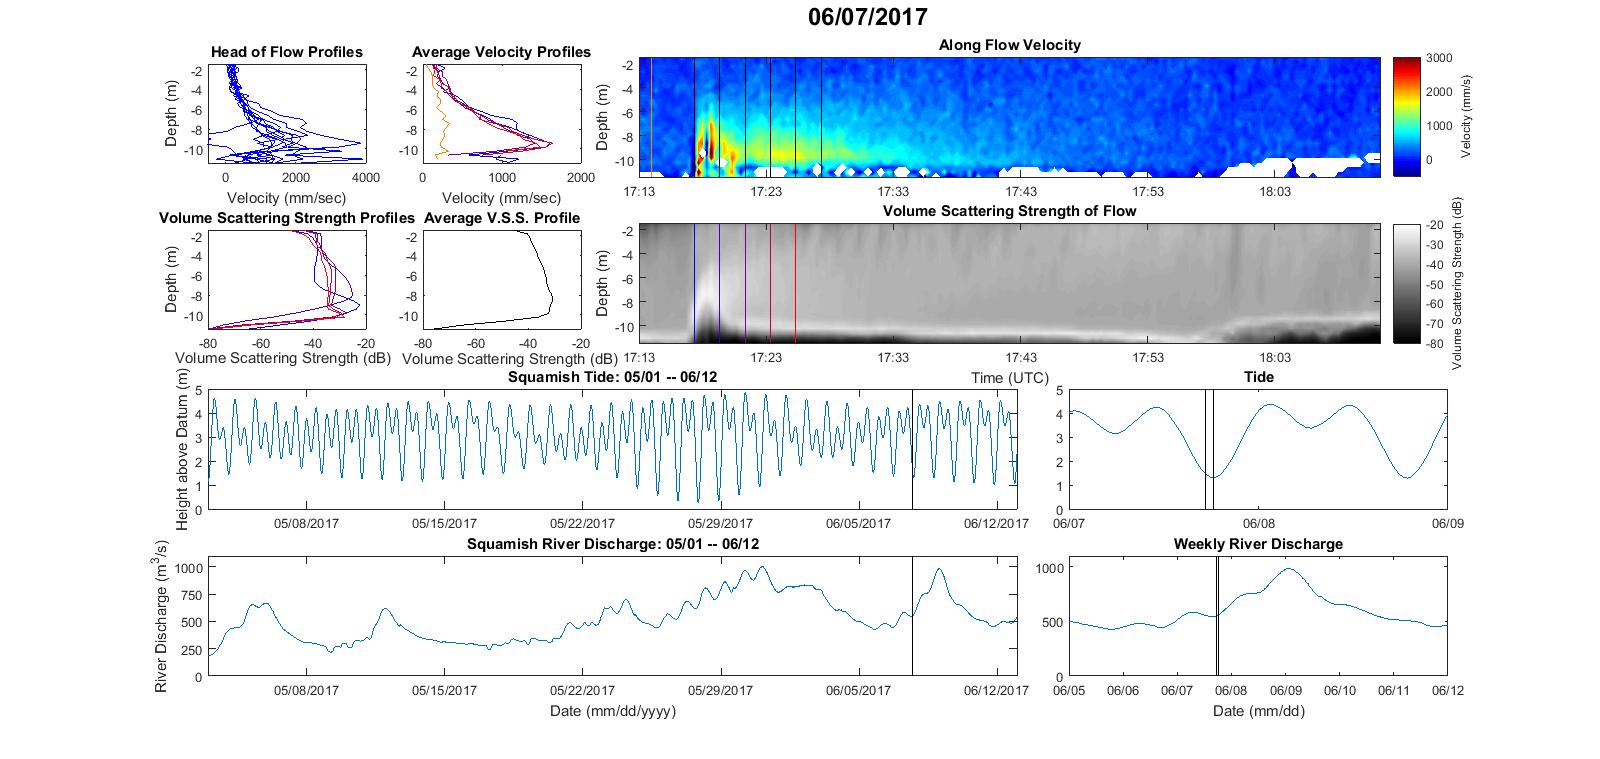
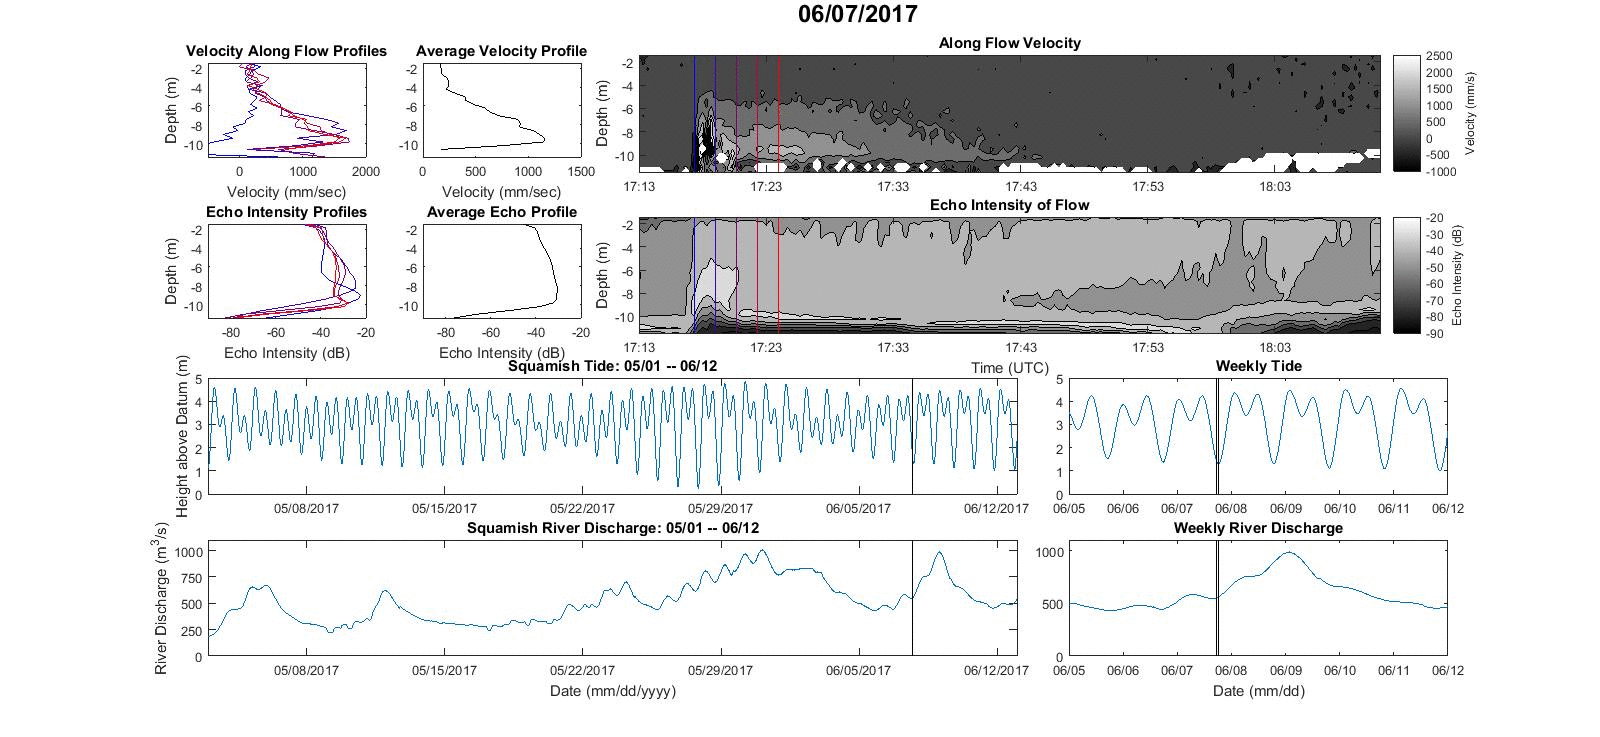
7th June
Peak ~ 1.7m/s
ACTUALLY sustained at 2.2m/s
peaking (if you believe it) to 5.0m/s
- 1718 - (28 minutes later)
- 1910 and
- 1945
The next three flow (159 A, B and C) all
occurred within the same low water period within 1.5
hours.
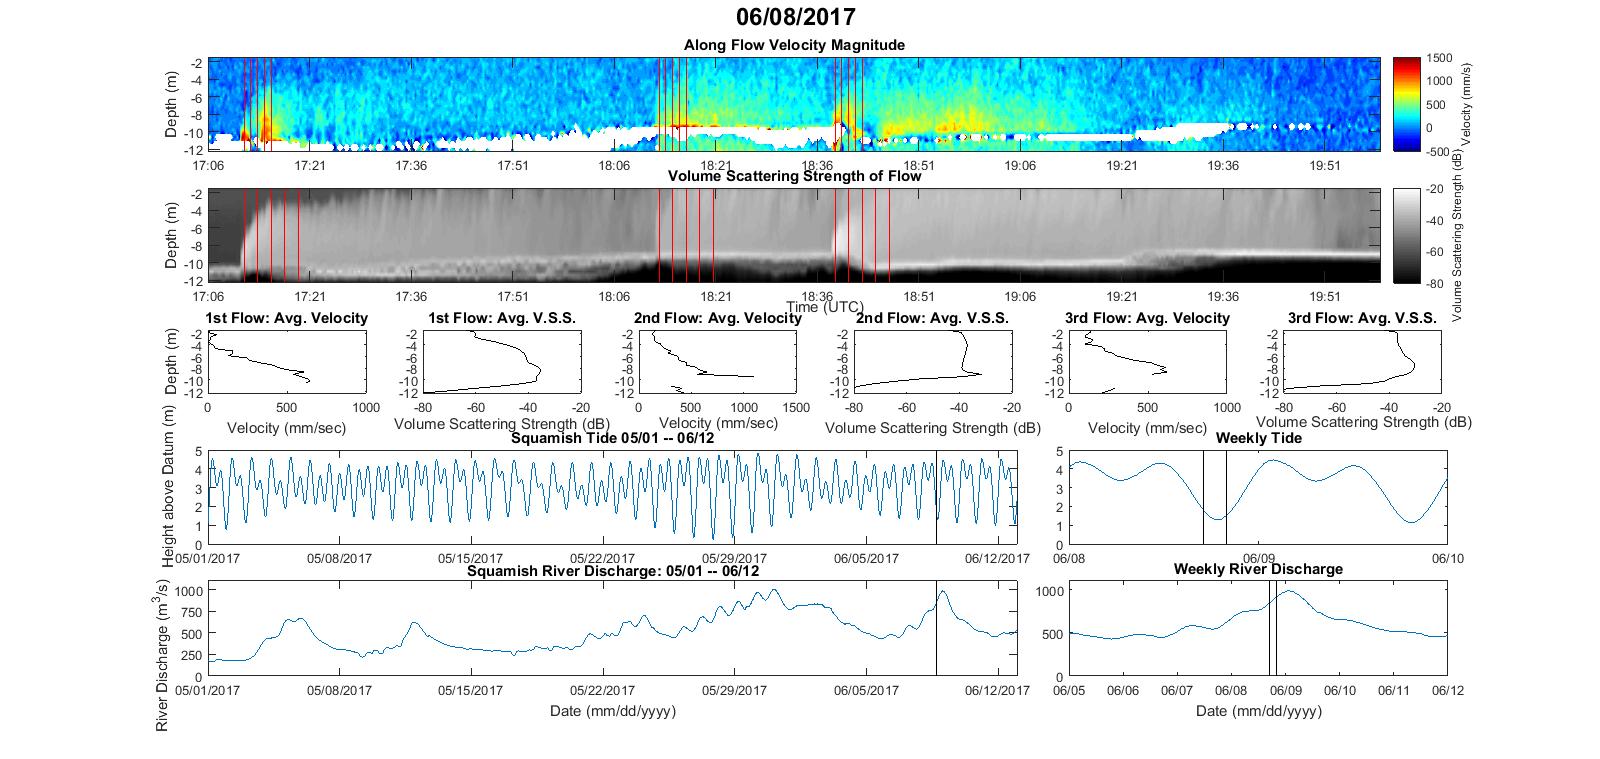
??? something wrong with the top velocity plot ????
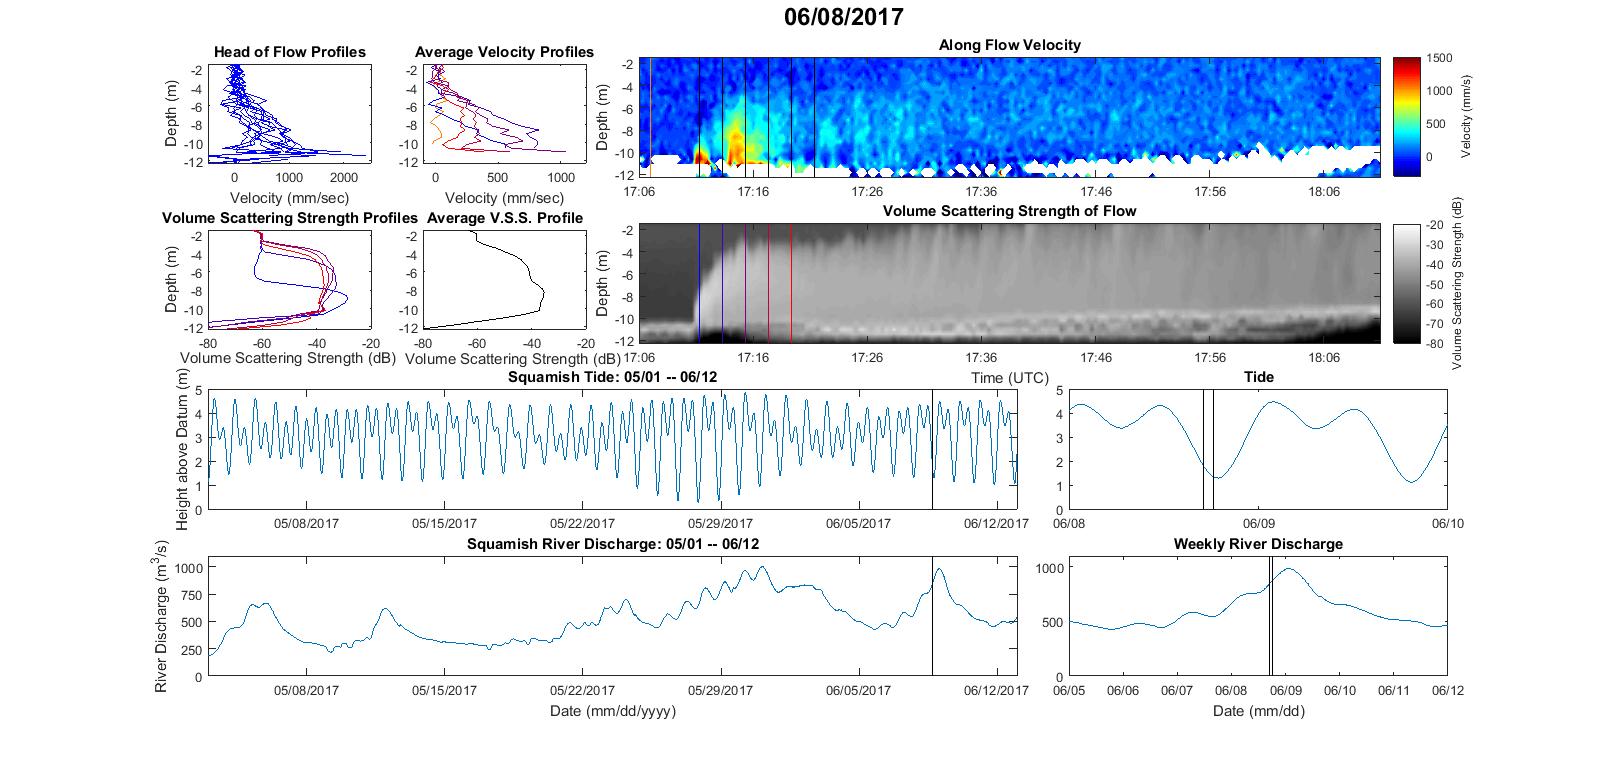
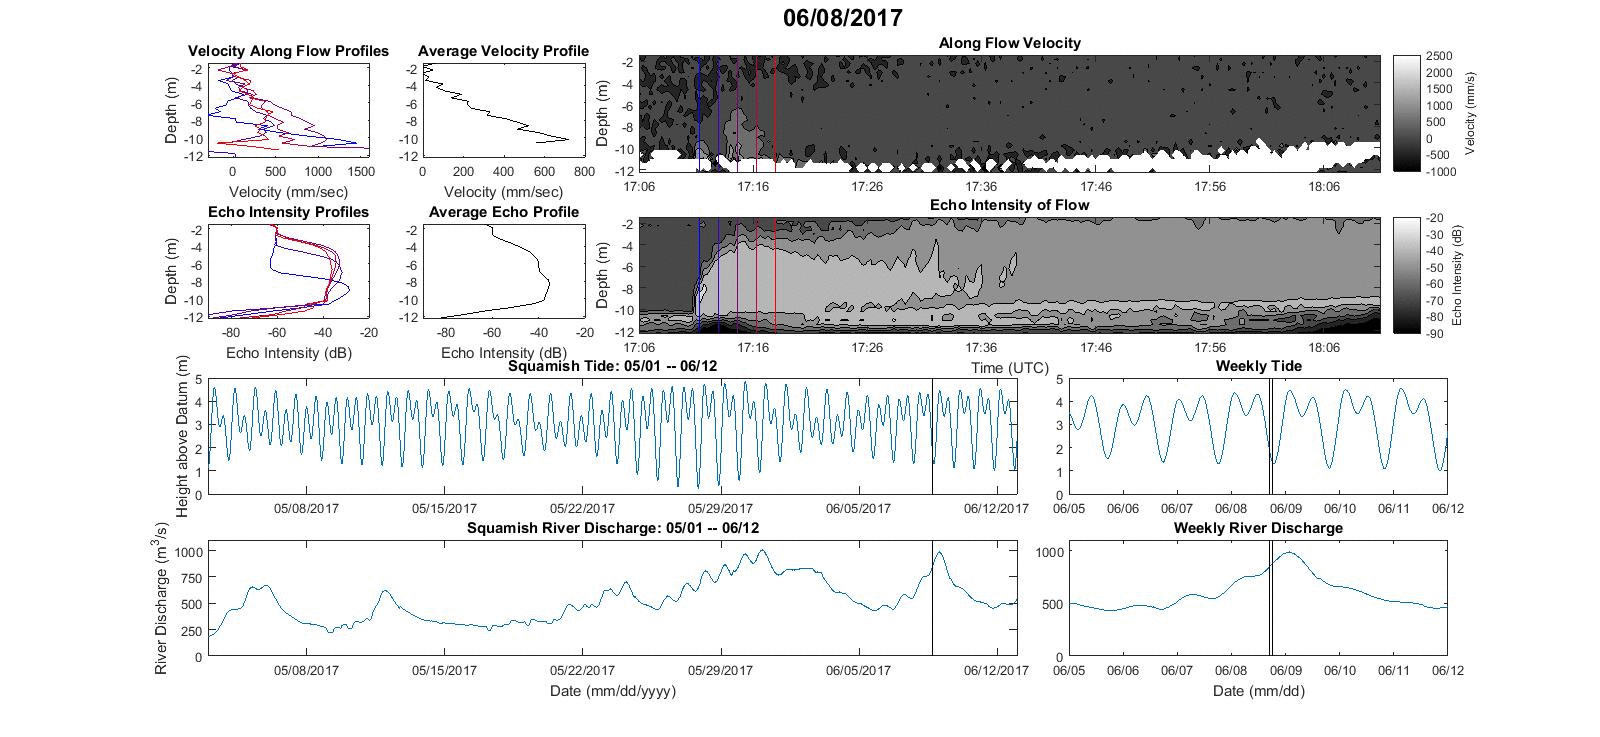
8th June
Peak ~ 1.5m/s
sustained is more like 1.0m/s
- 1711 - first of day...
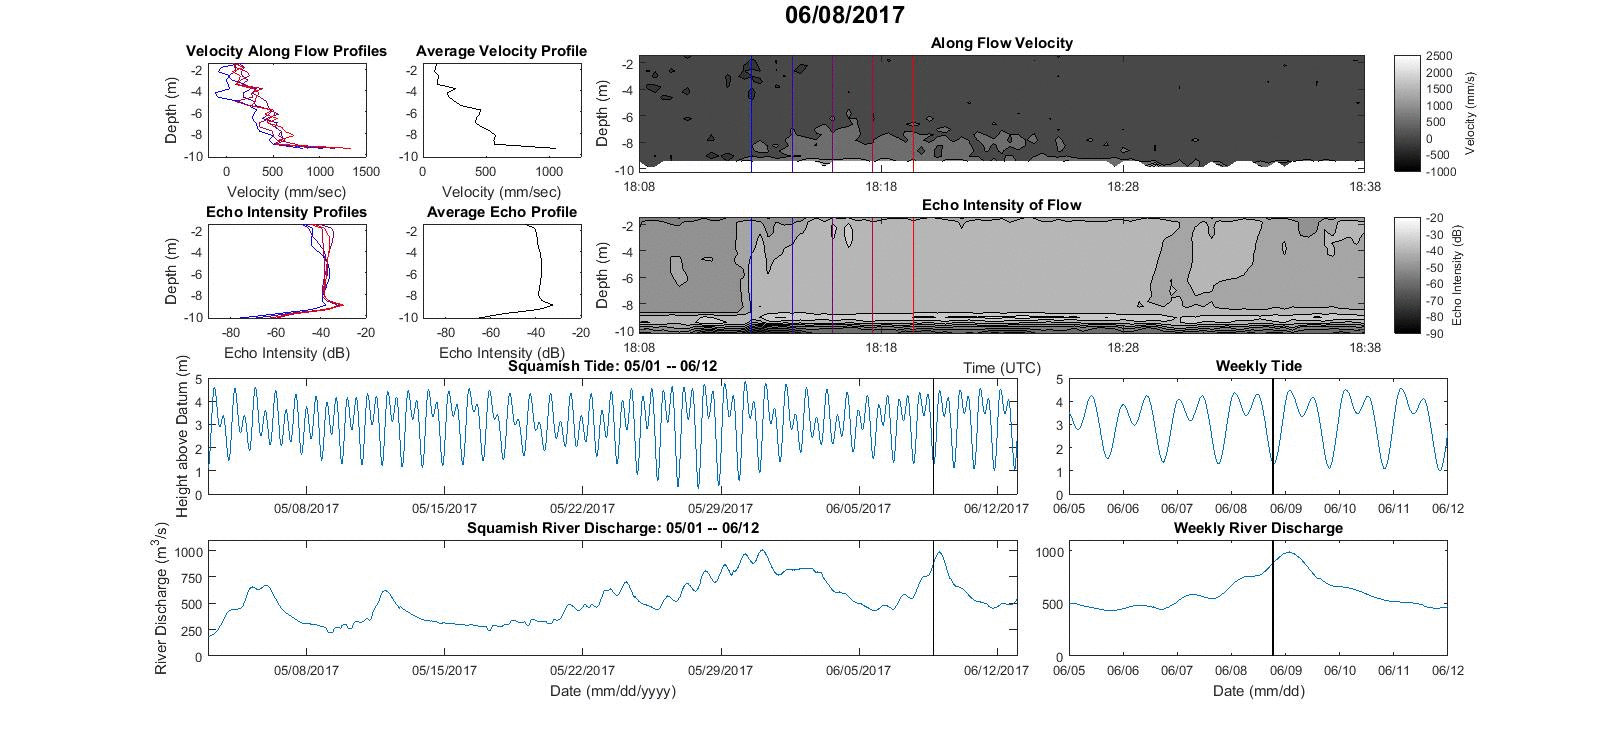
8th June
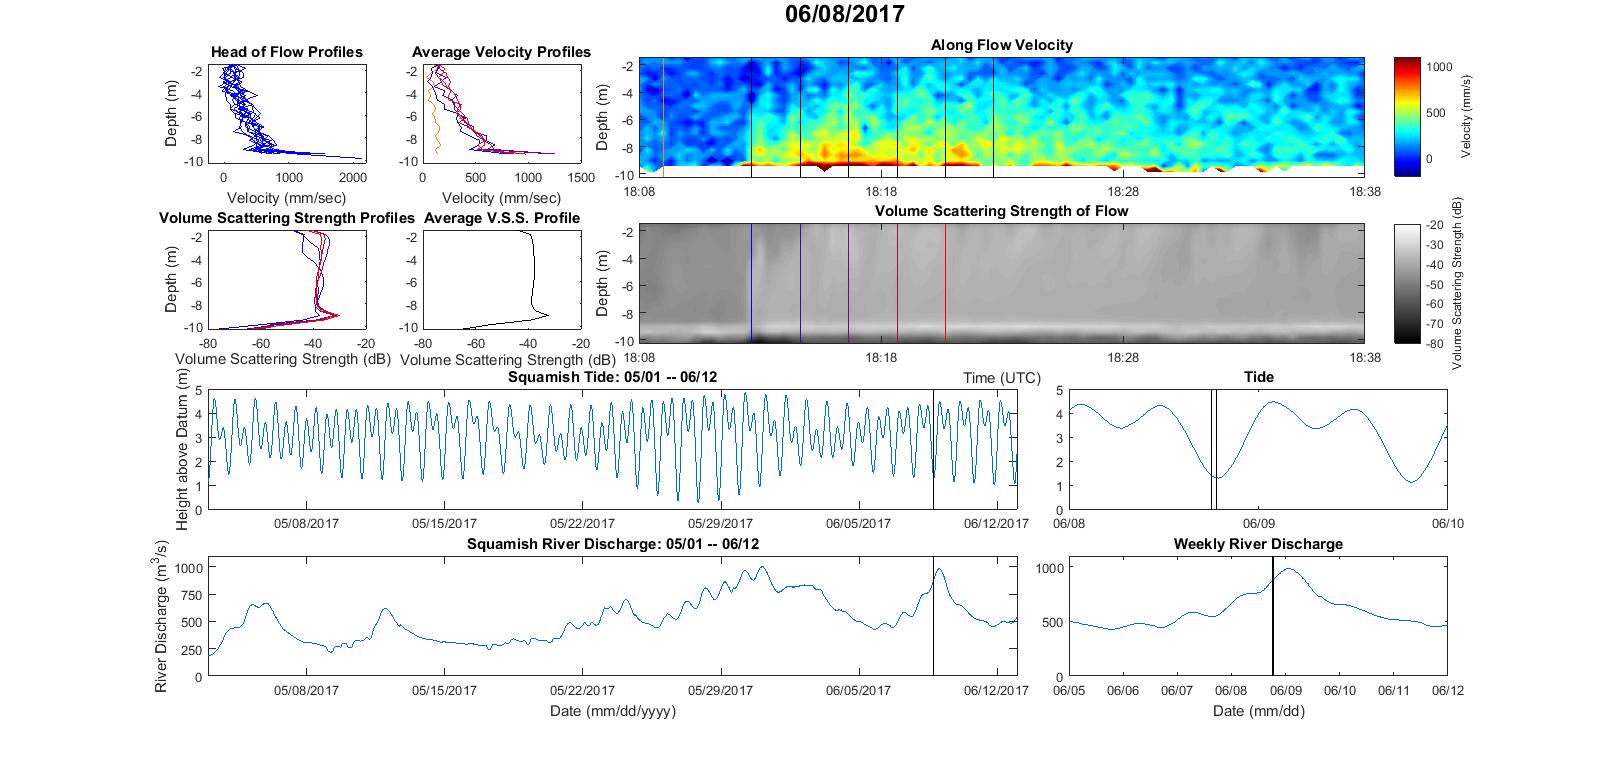
Peak ~ 1.5m/s
sustained is more like 1.0m/s
- 1813 (one hour later)
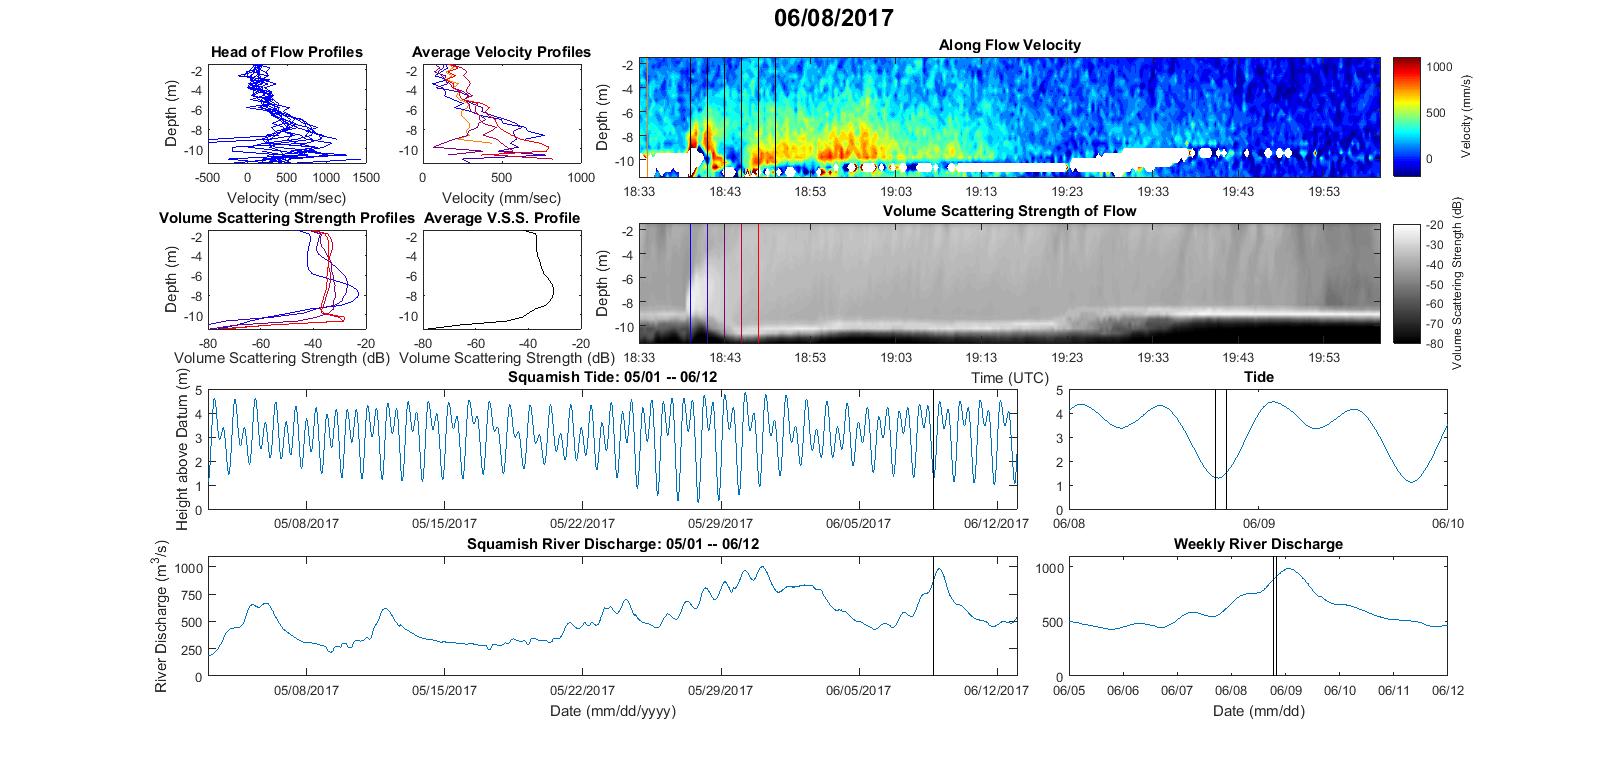
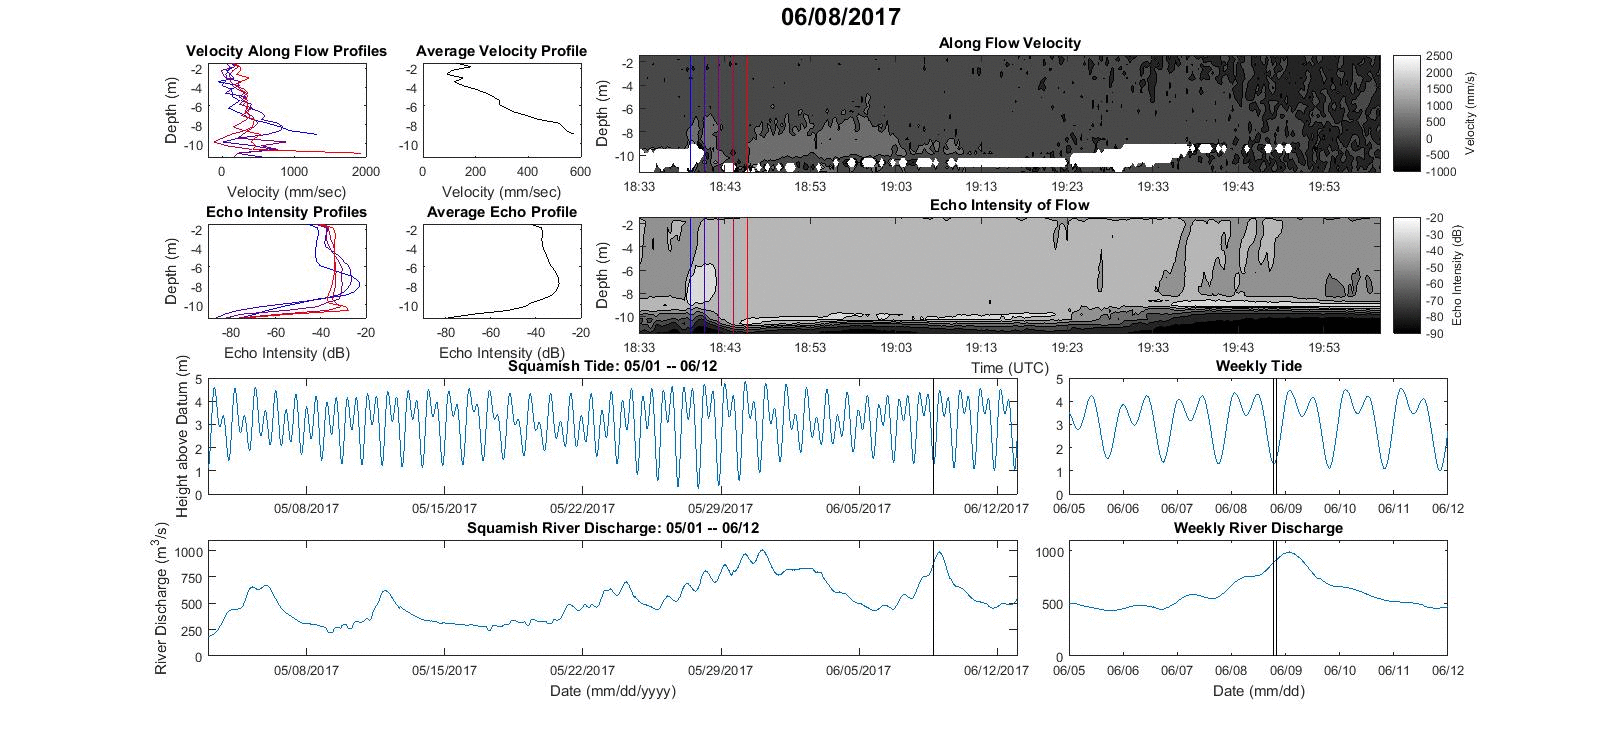
8th June
Peak ~ 0.8m/s
ACTUALLY head is sustained at 1.7ms
sitting for half an hour > 1.0m/s
- 1838 (25 minutes later)
On June the 8th at 2032 (well after the low water) the ADCP was lifted and the data downloaded and the battery replaced. It was subsequently redeployed on the early morning of the 9th of June, well before the following lower low water. There was no overnight bathymetric change.Thus no missing flow are suspected.
Based on daily bathymetric surveys for the next 5 days, there were no further flow events.
We have yet to recover the ADCP for the June 9th to July 11th period to see the subsequent activity.