| back to: Index |
CSL Heron
Squamish Operations April-October 2017 Water Column Anomalies due to JD159C Flow |
| John E.Hughes Clarke, Anand Hiroji, Liam Cahill | Ian Church, Angela Gillis |
| Center for Coastal and
Ocean Mapping University of New Hampshire, USA |
Ocean Mapping Group University of New Brunswick, Canada |
The
JD159C event 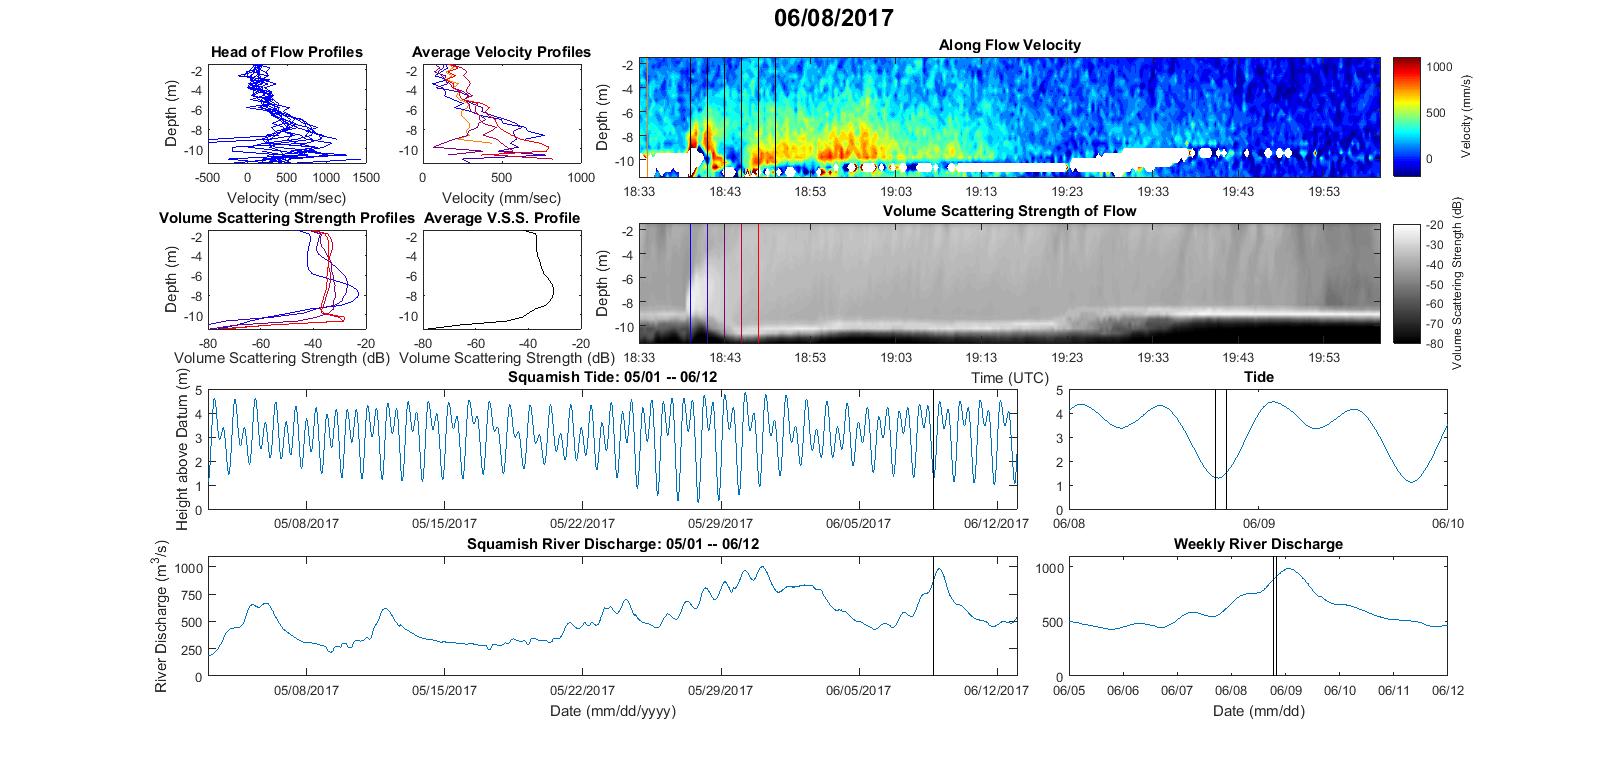
| Bathymetry Changes |
|
| bathy before |
 |
| backscatter while flowing |
 this is the image from the northern line that actually captured the flow while it is in the channel. |
Along Track Volume Scattering Sections: The following figures represent vertical sections showing the acoustic volume scattering directly below the vessel as it steams along one of the three survey lines. The data are exactly co-registered along the X axis with the plots above. Note that there are three tracks:
|
|
| line 20: to south seeing southern spillover |
 |
| line 21: to north seeing northern spillover |
 |
| line 22: along axis (steaming uphill) seeing head and gas release |
 |
| line 23: along axis (steaming downhill) head died continuing gas release |
 |
| line 24: along axis (steaming uphill) later gas release |
 |
 |
 |
| Line 21 - looking at the
active flow showing enhanced scattering across the floor of the channel - either sheet like gas release or actually turbulence on the top of the flow. Also showing disturbance of the plankton layer up on the channel flanks indicating that a subset of the flow is leaking out over the sides. |
Line 22 - looking at the
wake and consequences of the flow Showing gas column release preferentially from the eroded flanks of the channel. Also showing bulbous displacements of the plankton layer suggesting that the flow is rising in the wake (as it drops sediment, it is slight brackish and thus buoyant). The line up near the surface is a multiple. |
 |
 |
| showing the whole lop-sided
swath with the ADCP echo visible on the port side in the inner sector in the region after the minimum slant range |
Zoom of the image to the left,
showing the ADCP echo. |
 |
 |
| Showing ADCP location relative
to cyclic step wave crest before and after the JD159C flow. |
Showing the depth differences
resulting from the upstream migration of the bedform (greyscale - black-white = -2m to +2m) |