 The Oceanographic
Circulation of the
Port of Saint
John over tidal and seasonal timescales
The Oceanographic
Circulation of the
Port of Saint
John over tidal and seasonal timescales
Reenu
Toodesh
OVERVIEW:
As
part of the
sustainable
management of the Port of
Saint John there is a critical need to maintain sufficient under keel
clearance
for the various container and tour ship traffic in and out of the
harbour.
Because of the high and variable sedimentation, annual maintenance
dredging
is
necessary
to
keep
access
to
the
port
open
and
to
provide
sufficient
depth
at
the
berths
for
ships using the harbour.
The
Port
of
Saint
John
lies
at
the
mouth
of the Saint
John River on the north side of the macrotidal Bay of Fundy. Because of
this, the harbour
sedimentation is influenced
by two major sources of siltation. From
the river, the sediment flux is strongly modulated by the seasonal
variations
in river discharge.
From
the
ocean,
there
is
significant
resuspension
of
offshore marine
sediments which occurs in response to pseudo random
storm
events and seasonal meteorology.
To better
understand this complex
interaction which
occurs over tidal periods, high density oceanographic observations over
a tidal
cycle have been collected at four river level stages (winter minimum,
spring
freshet, summer minimum and fall freshet). Oceanographic profiles of
temperature and salinity were collected using the towed survey sensor
and
current magnitude, direction and acoustic backscatter with the use of
the
Acoustic Doppler
Current Profiler. Also, short
wavelength variability
in the
halocline was observed using the 200kHz volume backscattering
echosounder.
|
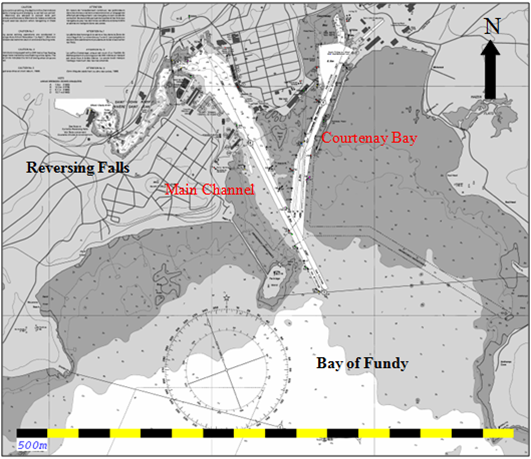
Figure 1:Map sshowing the location of the Saint John
Harbour.
|
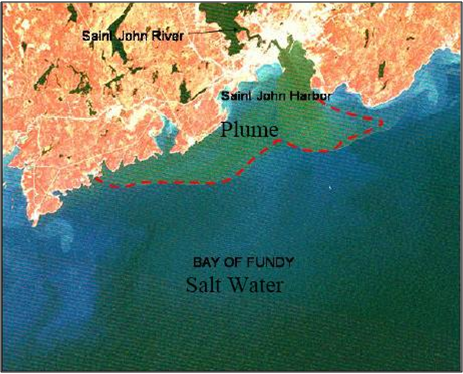
Figure 2:Satellite image showing the extent of the river
plume.
|
The figures above show the location
of the Saint John harbour with
respect to the macrotidal Bay of Fundy. It can also be see from the
satellite image, the river plume (shown by the turbid fresh water
surface layer) from the Saint John river during periods of high river
dischage. The turbidity of the water is related to the sedimentation
from the river discharge upstream of the harbour.
INSTRUMENTATION
USED:
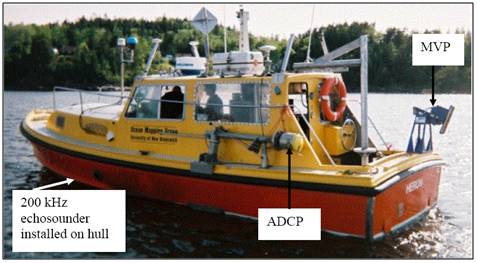
Moving Vessel Profiler,
MVP30
The
moving vessel profiler is an autonomous profiler used to collect
logitudinal oceanographic sections along the axis of the Main
Harbour and
Courtenay Bay channel. Vertical dips are made while the vessel is
underway collecting temperature
and salinity (which derives the density and soundspeed) and also
optical backscatter
which derives the amount of suspended sediments throughout the
water column.
ADCP
The RDI 600 kHz
workhorse ADCP was used to measure the magnitude of the velocity,
direction and
acoustic backscatter through the water column. The ADCP is mounted on a
pole
located on the port side of the vessel, with a draft of approximately
1.2m. This model ADCP consists of four
beams, each
of width 20°. As the vessel
moves, the ADCP emits pulses of sound which are reflected by scatterers
in the
water moving relative to the ADCP. While the vessel was operating at
speed of
4m/s, the ping rate of the ADCP was approximately1Hz. The frequency of
the
pings controls the range and the resolution of the data obtained, which
in this
case would be 4m.
ECHOSOUNDER
A Knudsen 320 B/P
200 kHz echo sounder with a beam width of 6° and pulse
duration of 0.1ms was
used. Thus the echosounder had a pulse length of 0.15m and an effective
range
resolution of 0.075m. For the surveys the gain was set to its highest
(100)
whilst the power was set to its lowest (1). The system is equipped with
an
amplifier that increases the intensity of the return echo.
Amplification of the
signal (increasing the gain) was preferred rather than increasing the
power
because the weak backscatter targets in the water column are considered
to be
ambient noise which is independent of the power level.The
echosounder was used to detect the short wave variability in the
halocline. The
range of the echosounder was set to measure depth of up to 50m. The horizontal
resolution of data collected was 0.5 to 1.5m and the vertical
resolution was
0.07m.
|
 |
Ocean
Mapping
Group's
Survey
vessel
showing
location
of
sensors
|
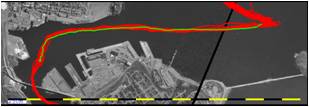
Ship
Track
along
the
Main
Channel
|
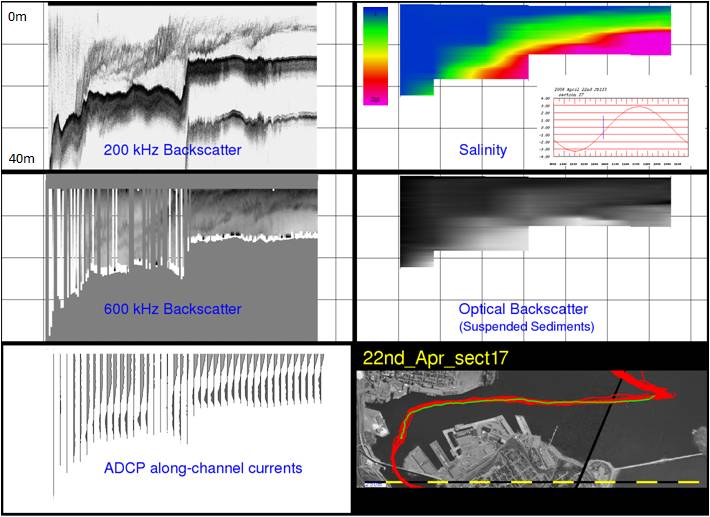
This is an example of the results
obtained from the specified instrumentation on board the Heron, using
OMG's software for post processing. All sections are showns for a
single transect along the main axis of the Main Harbour Channel.
For the plots the depth range is
(0-40m). This data is very useful in analysing the seasonal and tidal
variation of the salt water and fresh water mixing dynamics which is
heavily influenced by the large tides and the variable freshwater
discharge from the Saint John River and there the
estuarine circulation of the
Port of Saint John.
DATA
INITIAL RESULTS
- Winter Minimum -
March 26th 2009
- Spring Freshet -
April 22nd 2008
- Summer Minimum -
June 11th 2009
- Fall
Freshet
-November
14th
2008
Updated
By
Reenu
Toodesh
31/01/2011