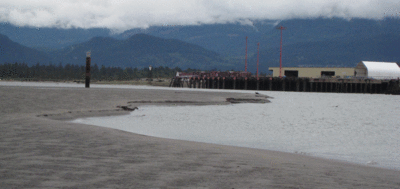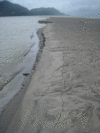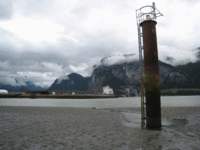
berth edge - LW Springs June 2011
scalloped edge of the intertidal shoal south of the navigation beacon.
This is the main area of encroachment into the berth 2 dredged basin
(otter for scale).

Squamish Terminals Berth Encroachment
Assessment of the 2006-2012 changes in the dredged basin

John E. Hughes Clarke
Ocean Mapping Group
Dept. Geodesy and Geomatics Engineering
University of New Brunswick
March 2013

Executive Summary
The BC Coast Pilots have recently expressed concerned about the extent of siltation in the Squamish Terminals berthing areas, particularly the region immediately adjacent to the actively growing Squamish Delta. This report is a compilation of the pertinent UNB survey data at the request of CHS Pacific (Peter Wills). UNB has been actively surveying the Squamish Delta front for the past two years.

Based on this analysis, it is clear that, from 2006 to 2012, the lip of the delta, immediately adjacent to Berth 2 of Squamish Terminals has prograded into the dredged basin by ~ 20m. At this point the entrance to the berth  is only 140m wide (as defined by the 5m contours).  This process appears to be accelerating as the main river channel mouth has now split off and formed a secondary channel that feeds to the east directly into the dredged basin.
overview
Fig. 1: overview of encroachment.

Overview

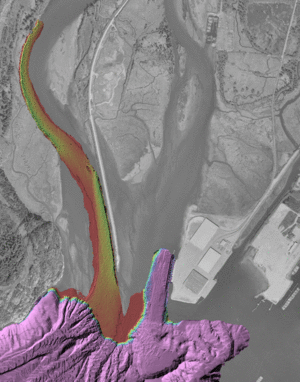
From 2006 to 2012 the Ocean Mapping Group at UNB has been collating multibeam bathymetric surveys of the Squamish River Delta that lies just SW of the Squamish Terminals facilities (Fig 2 left). The main purpose of this was to examine the slope failure that frequently occurs off the active front of the river mouth (see link). From time to time, the surveys would extend around the front of the delta into the much less active region that flanks the western side of the berth 2 terminal (Fig 2 right). As a result there is the ability to assess progadation of the flank of the delta into the dredged area. This page illustrates the principal findings over the ~ 6 year period.

Figure 2: left and right
Squamish Terminals facilities
Prograding and Avulsing Delta Front adjacent to Berth 2.
docks
delta top

Sequence of Surveys:

Historical Surveys:
Single beam surveys of the delta were performed in 1973 and 1990. The 1990 survey used to be the major source of information in the local chart (3534).  The intertidal contours actually remain 1990 vintage. In 2004, the first multibeam survey of the deeper delta (only as shallow as ~60m) was performed by the CCGS Vector in 2004 using an EM1002 for an NRCan reconnaissance. In 2005, the same vessel undertook a more systematic survey extending up to about the 40m contour for CHS charting purposes. Neither of these surveys examined the delta lip (which extends up to the drying line) or the dredged basins for Berth 1 and 2 of Squamish terminals.
In the intervening period, single beam surveys have been conducted for Squamish Terminals by CRA (contact Alex Howden) at least from 2005 to 2010. These typically just define the dredged basin using single beam data with about a 10m -15m line spacing which makes it hard to precisely define lateral shifts in banks..

First Multibeam Surveys of the Delta Lip:
The first multibeam surveys that extend to the delta lip were conducted from the CCGS Otter Bay in the Spring of 2006 and 2007 using an EM3002 (see sample data below). With a ~1.8m draught, the vessel was reluctant to steam over the delta lip to investigate the intertidal zone and up the river channel. Nevertheless, the delta lip up to the 5m contour (Chart Datum referenced) and the dredged basins were clearly established in those years.

In ~ 2009, the charted extent of the delta lip was modified from the 1990 depiction to reflect these more recent surveys.  The 5m contour established from multibeam closely matches the current contour depicted on CHS chart. The one exception is the depicted most southerly extent of the delta (the 0.2m sounding). This shoal sounding is clearly not based on any multibeam data set collected from 2004-2012.  Possibly a single beam survey conducted by the CHS between 2007 and 2009 may be reflected here.

Surveys subsequent to 2007 (up to 2012):
In ~ May 2008 an additional survey was performed by the OtterBay. It is apparent however that there are slight horizontal positioning issues with this survey. In April 2009, the CCGS Vector returned and undertook a survey of the deep (> 50m) prodelta but did not examine the delta lip or the dredged berths.

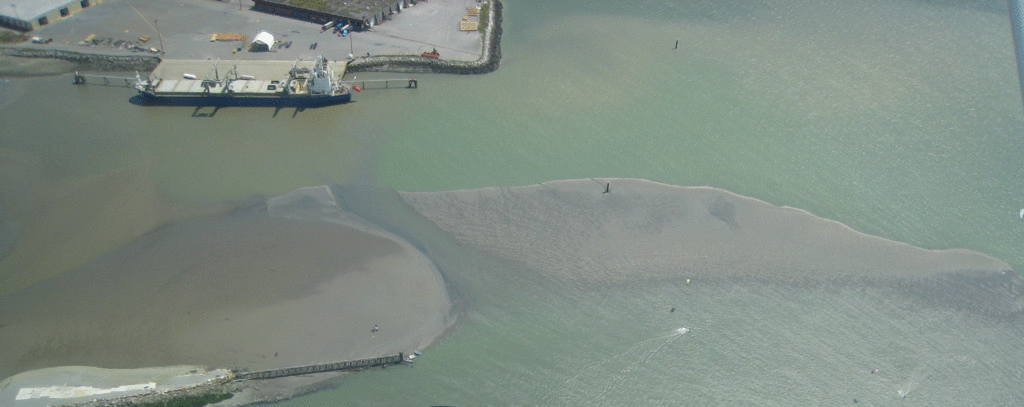
In November of 2010, a year long deployment of the CSL Heron began in which monthly surveys were conducted through the winter months followed by weekday surveys during the May-August time period. These surveys included the delta lip and extended up the river channel for ~ 2000m (see 2011 sample below). Additionally some of the intertidal region was captured along the flank of the dredged basin adjacent to berth 2. Three examples of these surveys are provided in digital form in this report. Significantly, in 2011, for the first time, a lateral avulsion of the main river channel was recognized that now feeds a subset of the river into the dredged basin (Fig. 3 below). This channel was surveyed twice in 2011.

berth edge - LW Springs June 2011
Figure 3: Aerial photo showing the channel avulsion immediately to the east of the tip of the training dyke.

In 2012 the CSL Heron returned for surveys in July, September and November. In July the new channel avulsion was resurveyed. The November 2012 survey represents the latest delineation of the delta lip.  2013 surveys are currently scheduled for ~ June.

In 2011 and 2012, the Heron did partially survey the intertidal zone as she has a keel draught of 1.15m and a transducer depth of 0.8m. It should be noted, however, that an EM710 is not designed to work in less than 5m of water. Typically there was less than 3m under the keel for most intertidal surveying (1m under the keel was the minimum recorded).

Representative Sample Surveys:

The following three surveys are provided as ESRI binary grids to compare:
April 2007
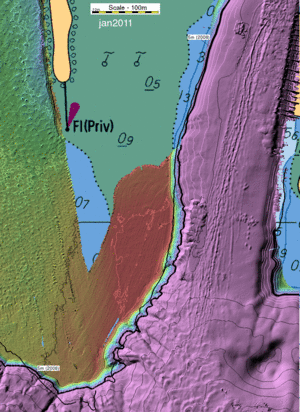
January 2011
November 2012
CSS Otter Bay EM3002 survey performed by CHS Pacific
(Czotter and Lessels)
RTK GPS for horizontal control.
Reduced using observed tides at Squamish.
CSL Heron EM710 survey performed by OMG/UNB
RTG-GPS for horizontal control.
Reduced to CD using Point Atkinson predicted.
CSL Heron EM710 survey performed by OMG/UNB.
RTG-GPS for horizontal control.
Reduced to CD using Squamish predicted.
April
                2006
January 2011
November 2012
ESRI binary grid file
flt - hdr
ESRI binary grid file
flt - hdr
ESRI binary grid file
flt - hdr

For all grids, the projection is Mercator (WGS84) and reference latitude is 49.7°N. All depths are reduced to Chart Datum.  Observed tides at Squamish exist for 2006 and 2007. While Point Atkinson observed tides exist for 2011 and 2012, all those data here are reduced using a predicted tide. PPK ellipsoid heights are also available.


Progressive migration of 5m contours adjacent to Berth 2:
5m contour
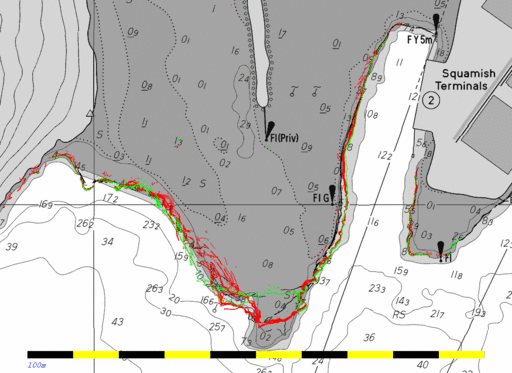
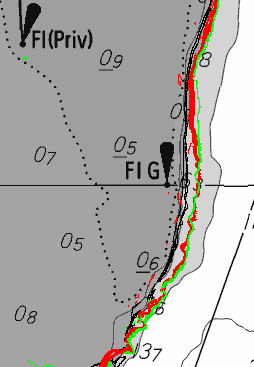
Using the 2006, 2007, 2011 and 2012 surveys, the delta lip can be monitored using the 5m contour as a reference. The figure to the left shows an extract of CHS chart 3534 in which the following colours indicate the 5 m contours:
  • BLACK - 2006 and 2007 surveys
  • RED - all 2011 surveys.
  • GREEN - all 2012 surveys
Note the very high variability in the front of the delta (where the main river discharges) from year to year (and actually day to day in 2011).  Also note that the shoal to the SE of the berth has not changed at all  in the 6 year period.

Note also that no multibeam survey has ever recorded the delta nose protruding out as far as the charted 0.2m sounding.


beacon
Navigation Beacon on prograding intertidal shoal
If we focus in on the edge of the intertidal platform on which the navigational beacon  (Fl G) is embedded, we can see that the contours cluster much closer together indicating a relatively stable edge over short periods. The figure to the right however, shows that there is a gradual progression from year to year.
The black contours indicating 2006/7 match the chart almost exactly. In contrast the red contours (2011) show a clear progradation immediately to the east of the beacon of about 15-20m. And the green contours (2012) show that this is continuing, especially to the north where the channel avulsion is most active.
The greatest progradation occurs adjacent to the navigational beacon. The detailed multibeam images below show the style of the submerged seabed within the adjacent dredged berth.

erosion
morphology of the edge of the intertidal delta lip, looking south from the beacon


zoom of intertidal shoal

Focus on the Berth and the 2006-2012 growth:


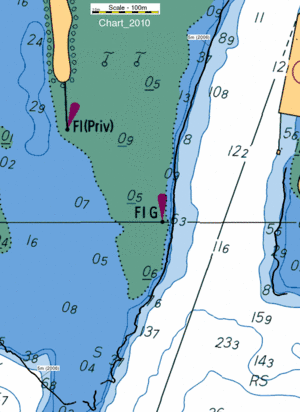
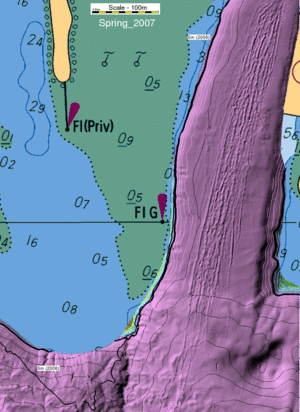
for all the following figures, the backdrop is CHS chart 3534 (with modifications up to 2010). Superimposed on all figures is the 5m contour (CD referenced) based on the 2006 Otter Bay multibeam survey.  For each epoch, the new data is illustrated as a terrain model superimposed over the chart. The new data is contoured at 1m intervals to a depth of 5m (white contours) and 5m intervals thereafter (black contours).  The  new 5 m contour is indicated by an extra thick black line to directly reference it to the 2006 base.

Reference Surveys
CHS Chart 3534 (2010 vintage)
Spring 2006
Spring 2007
Chart 2010 with 2006 contour
Spring 2006
Spring 2007
This shows the charted 5m contour and the comparison to the spring 2006 multibeam rendition of that contour.  Note that the chart records a greater progradation of the delta lip than seen in the multibeam.
This is the spring 2006 survey which is the first multibeam rendition of the delta lip. This represents the furthest south extension of the delta lip recorded thus far by multibeam. Note that the drying line was not investigated due to draught clearance concerns.
This is the spring 2007 survey. Over the summer of 2006 the delta lip collapsed resulting in a >100m retreat of the 5m contour. By the end of the 2007 summer, much of that retreat had been reacquired by delta lip advance.
Note that in one year, the flank of the delta by the navigational beacon had advanced by a few metres.

2011 Surveys
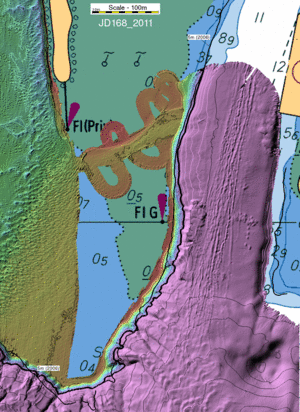
January 2011 JD168 2011 JD234 2011
This was in late January at a very low discharge period. It represents the most extensive survey done of the intertidal shoal.
This reveals that there was a localized dredging effort immediately seaward of the 5m contour where it encroaches on the berth.
From this, one can see ~15m of progradation of the delta lip by the beacon since 2006
This was in mid summer when the river was very active. This was the first time that the avulsion channel was surveyed.
This was in mid August when the river was slowing down (although a surge occurred on this day). This is the last record of the channel in this year.
Note than over the 2011 summer the delta lip off the avulsed channel mouth has prograded more rapidly than off the beacon.


2012 Surveys
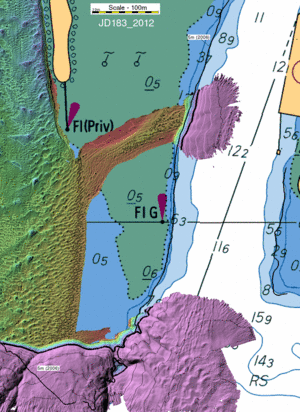
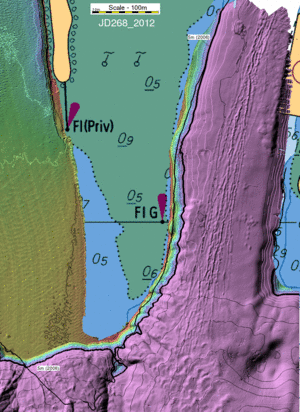
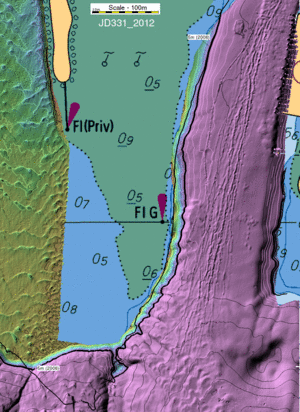
JD183 2012 JD268 2012 JD331 2012
This was the only time we examined the avulsion channel in 2012. This was during the active summer period.
As can be seen, the 5m contour has now prograded ~ 10m out into the dredged basin. Slightly more than in 2011 (~7m then)
This was in September after the river level had dropped. No significant activity, as can be noted from the lack of river floor bedforms.
This was in late November just after the autumn storms. The delta front had changed significantly, but the flank of the delta appears the same.


page developed by JEHC, February/March 2013.