change
Oct 2016
to
Apr 2017
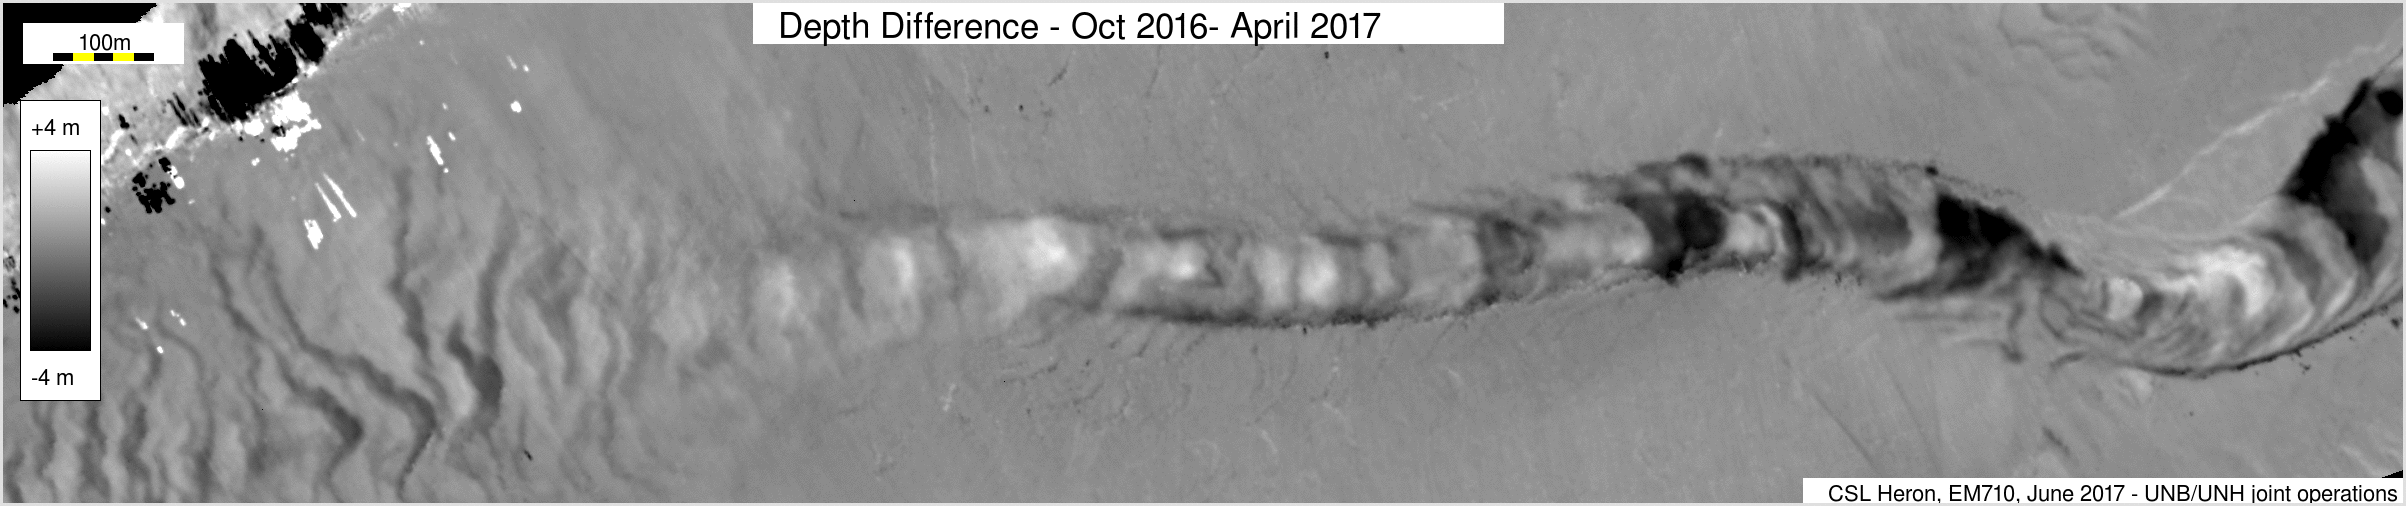
As can be seen, the 16-17 winter was a period of remarkably activity. This reflects the unusual amount of rainstorm events in the autumn period.
Note that this difference map utilizes survey data collected by GSC and NOC on board the CCGS Vector the previous October.
Spring low discharge inactivity.
change
April
to
May
low
discharge
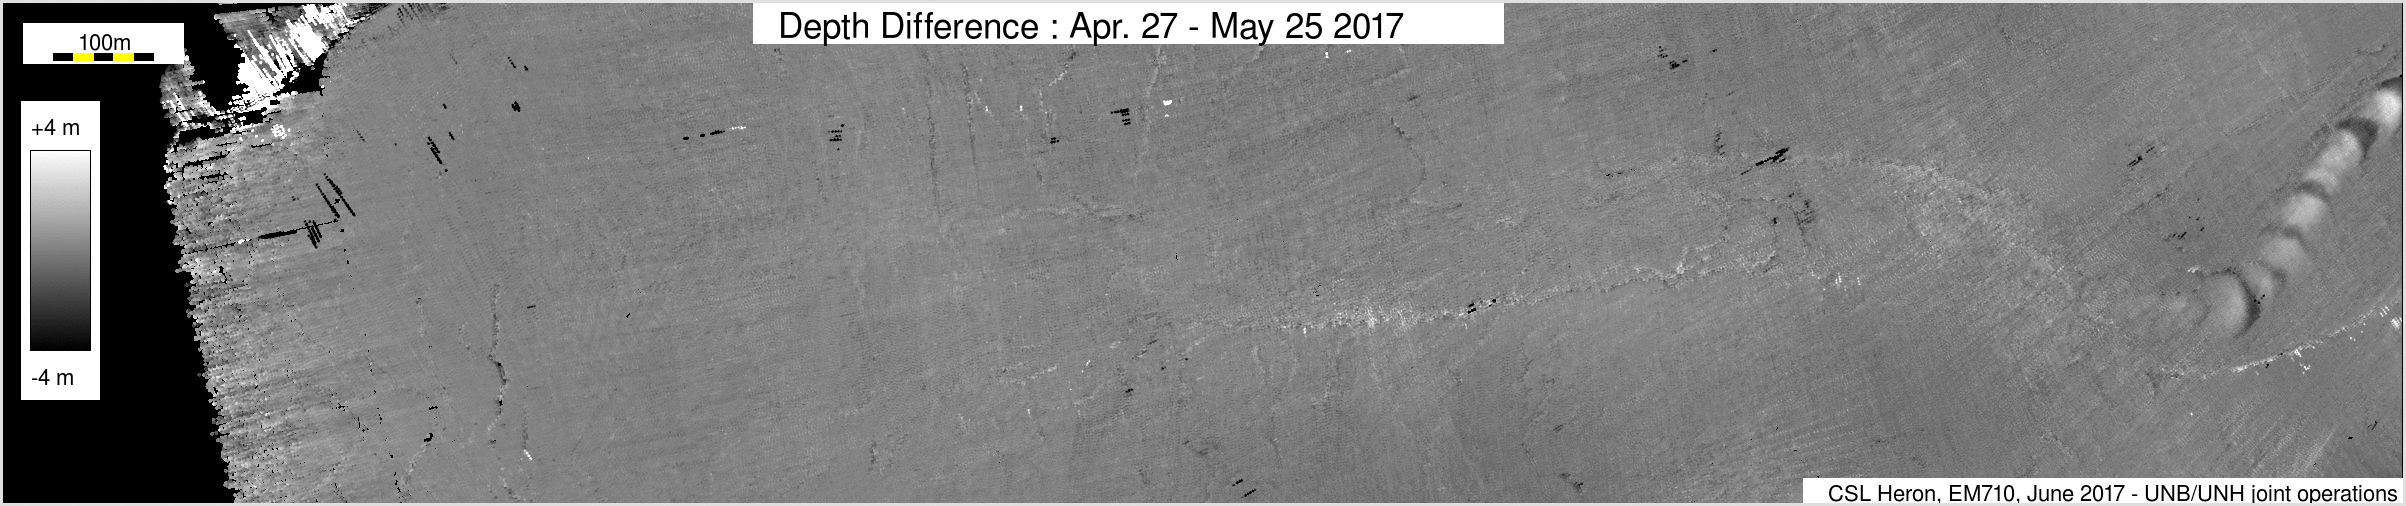
As indicated by Environment Canada's discharge record, there was little likelyhood of major flow events in the first period. The ADCP, however, clearly showed that three flows did occur in this window, but with a maximum flow velocity of ~0.3m/s.
First flows of the year
change
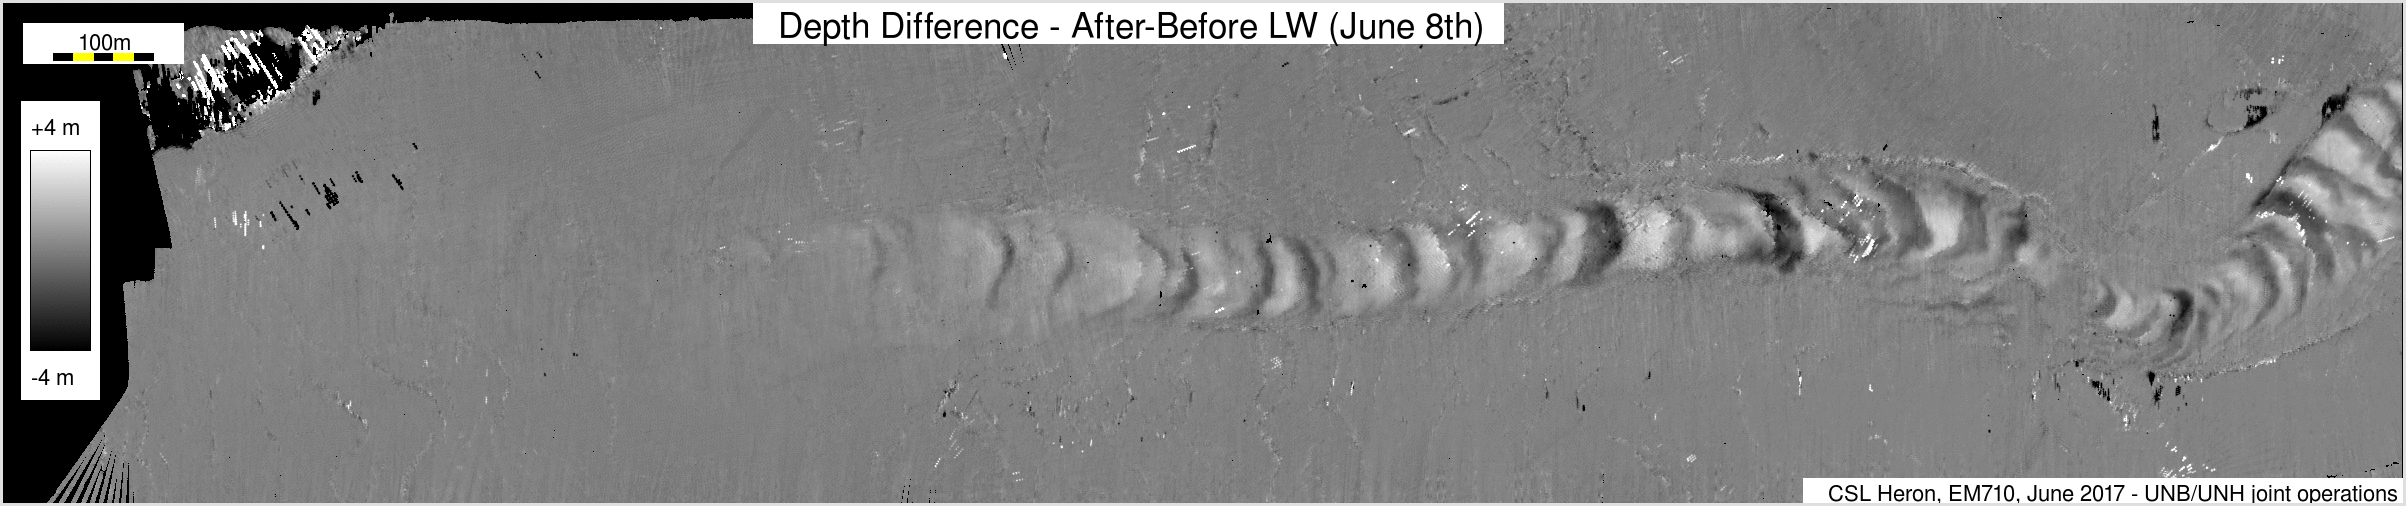
May
to
June
increased
discharge
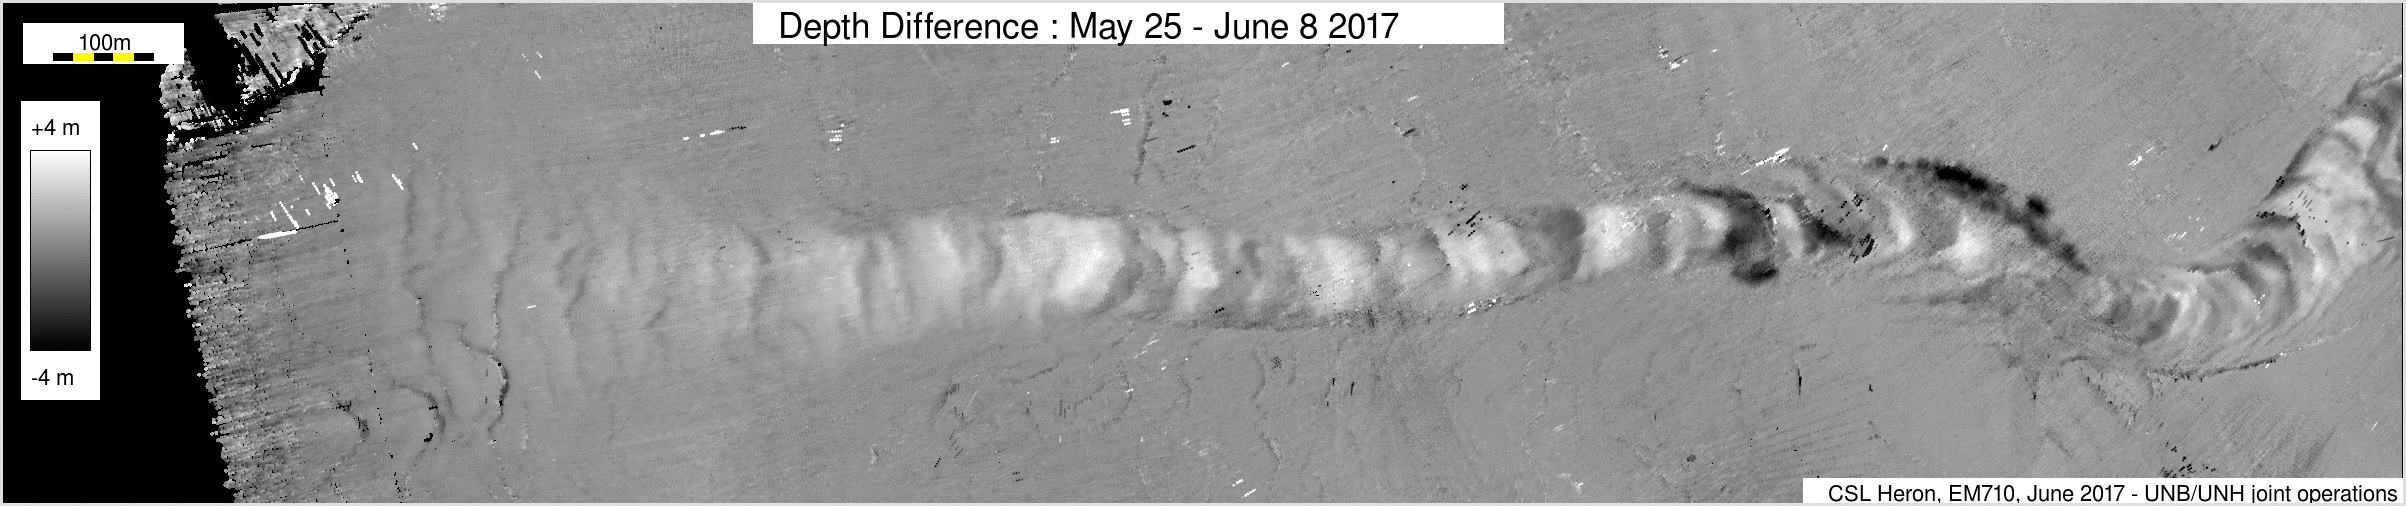
In the next two weeks there was much more activity. Based on the ADCP data, while there were 9 flows, the seabed change was probably dominated by just two of them.