|
SE4083 - Hydrographic Field Operations 2000 the class of SE4083-2000
|
|
|
SE4083 - Hydrographic Field Operations 2000 the class of SE4083-2000
|
Overview
A hydrographic, oceanographic and geophysical survey was executed in
May 2000 as part of SE4083 - Hydrographic Field
Operations. SE4083 is a 4th year undergraduate course offered within
the Dept. of Geodesy and Geomatics Engineering at UNB as part of the specialisation
in Ocean Mapping. The aim of the course is to expose the students to the
practical issues involved in the planning, execution and processing involved
in a coastal marine survey.
Area of Interest
 |
The area chosen for the 2000 course was the Kennebecasis Estuary which
is a fjord-like basin that lies off the main St. John River system. The
Kennebecasis lies parallel to Long Reach, both of which are obviously constrained
by the structural orientation of Lower Palaeozoic bedrock outcrop in Southern
New Brunswick.
Unlike Long Reach, through which the main St. John river flows, the Kennebecasis has almost no fresh water flux. The Hampton river at its NE end provides only a minor inflow. |
 |
The Kennebecasis had last been surveyed for Hydrographic purposes in
the 1930's. Whilst upstream sections of the river had been surveyed in
the early 90's (using conventional single beam technology), the Kennebecasis,
with its greater depths and non-existant commercial traffic had not been
a high proirity for resurvey. We thus had the opportunity to gh proirity for resurvey. We thus had the opportunity to provide a
useful bathymetric survey of an area that is actually used extensively
by the local recreational yachting community. In addition, as demonstrated
below, the area was one of high oceanographic and geologic variability
and thus served as an excellent training model to introduce the students
to environmental and geophysical survey applications.
 |
The focus for the SE4083 field program was the south western end of
the Kennebecasis where it shoals into Grand Bay. Reconnaisance Knudsen
sounder surveys in 1999 indicated two things:
|
Survey Platforms and Instrumentation
The survey was carried out using two platforms:
Survey Design
 |
The choice of optimal survey instrumentation was primarily dictated
by depth range. The Plover- EM3000 operates at 12 knots, but it's swath
width is a direct linear function of water depth. We followed the CHS practise
of running heavy inter-swath overlap to ensure high quality data. This
restricted the line spacing to ~ 2x water depth.
In contrast, the Knudsen sidescan provides a 50m wide swath on one side almost irrespective of water depth. As the 200 kHz channel of the Knudsen could only be used for one of the downlooking or side looking transducer, only every second line was operated with the sidescan (and thus all sidescan looks in the same direction). As a result Knudsen line spacing was restricted to 20m (40 spacing of sidescan imagery with 10m slop for overlap). Thus in less than 10m of water, the knudsen imaging became more e imaging became more efficent
in coverage (sidescan only though, incomplete bathymetry).
|
 |
Survey Execution
The Plover was used for the first 5 days to cover the 10m+ depth area
of the basin and to explore the channels discoverd to the west (see below).
The Knudsen was then used for 10 days with a fixed 20m line spacing oriented
orthogonal to the long axis of the Kennebecasis.
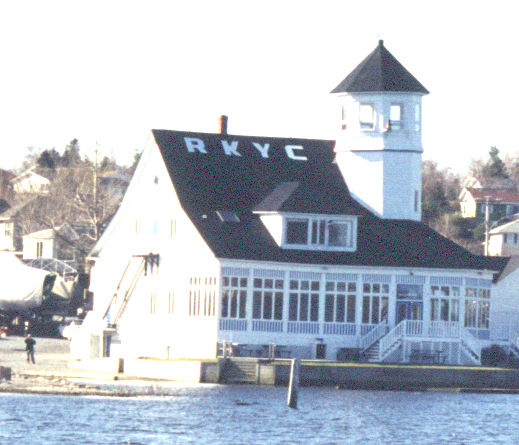
Tidal control was obtained from a CHS tide gauge temporarily mounted on the edge of the RKYC dock. The gauge elevation was levelled to a local geodetic datum marker ~ 1km away by the students of the Survey Camp II class under the guidance of Howard Biggar.
EM3000 survey results
 |
The EM3000 survey extended from the sill at Grand Bay to just NE of
the entrance to Milkish channel. 200% multibeam coverage was obtained for
most areas, and transit lines in and out of Brothers Cove were compiled
to build up a picture of this shallow embayment. Using the OMG/UNB
Sunb.ca/~jhc/SwathEd.html">SwathEd
software, the data were merged with tide and navigation, edited,
gridded and mosaicked on a daily basis by the students themselves.
A number of particularily interesting features were noted: |
 |
Submarine Channels
On the flanks of the sill, at the SW end of the Kennebecasis, large erosionally scoured channels were identified from the multibeam survey. No indication of these channels exists from the historic hydrographic data (although, given that it was a lead line survey, this is hardly surprising!). As part of a foart of a follow-on Oceanographic study of the sill conducted later in June, July and October, it became apparent that these channels are carved by salt water density flows that are generated as the flood tide lifts the halocline over the sill. |
 |
Wrecks x2
In ~35m of water in the centre of the basin, two tugboats were located, each ~ 25m long and standing ~3-4m proud of the seabed. Neither of these wrecks were recorded on the chart, but local knowledge suggested that they were two surplus vessels scuttled in the 50/60's. In the same area, ring-like structures, visible in the bathymetry but not in the backscatter indicated that this region had been an historic dumpsite. |
NE Tug - details of raw MB data |
The raw full-res. multibeam data indicate that both tugboats are upright, and assuming the superstructure is on the forward end, are facing north. No evidence of masts or other obstructions was noted but they may have not been resolved. | 
SW Tug - details of raw MB data |
 |
Wreck in Reversing Falls approaches
A third wreck was noted, during transit through the gorge immediately upstream of the reversing falls. Again this wreck is not reported on the chart. It lies in 20-30m of water, and is ~60m long. Local knowledge suggests that this is a sunken barge. The transit lines through the gorge were compile to produce a single
bathymetric image of the Reversing
Falls itself....
|
 |
Seabed "Creases"
In the deeper section of the Kennebecasis in talweg lows between the intra-basin high and the flanks of the basin, narrow sinuous cracks or "creases" were identifed from the multibeam bathymetric survey. Shallow subbottom surveys (see below) showed no obvious subsurface structural features associated with these cracks. |
Knudsen sidescan imaging results
| Brothers Cove
The pole-mounted sidescan imagery provided optimum results in watergery provided optimum results in water depths less than 10 metres where the aspect ratio was low. The most interesting results were obtained within Brothers Cove in 4-8m of water. A logging mill had been located in Brothers Cove in the early part of the 20th century. The sidescan imagery clearly revealed scattered large logs on the seabed. If those logs are in good condition (this is not a given, since they lie in the upper, oxygenated fresh-water layer) they could be quite valuable. |
 |
Knudsen 28 kHz subbottom imaging results
 |
The stacked sections in the left hand image were obtained frommage were obtained from the box in the right hand image. They clearly show the spatial evolution of the horst-like structure that sits up in the centre of the basin. |
 |
A detailed view of the seismic cross-sections reveals:
|
 |
Knudsen 200 kHz downlooking imaging of the halocline
 |
For every second Knudsen line, the 200 kHz channel was diverted to
the downward looking 6 degree transducer. The power and gain levels were
set to maximise the visibility of the in-water column scatterers. The halocline
was apparent for the entire survey, with a slowly changing character. Large
perturbation of the thermocline at this time wetion of the thermocline at this time were not, however, noticed
in the May survey. This was probably due to the high spring freshet (~3-5m
over datum during the survey) which depressed the halocline and prevented
influx of new salt water from the ocean on the flood tide.
Later studies of this phenomena, however, in June, July and October as part of a follow-on Oceanographic study of the sill revealed much more variability and detail. |
Instructor
John E. Hughes Clarke
Technical Support
Howard Biggar
Jerry Zhang
Teaching Assistants
Edouard Kammerer - EM3000 operator
Graham Nickerson - Knudsen operator
Anya Duxfield - SwathEd demonstrator
Anders Akerberg
Jill Coles
Rob Tremblay
John Winistok