John E. Hughes Clarke
© Ocean Mapping Group, Dept. Geodesy and Geomatics
Engineering
University of New Brunswick, CANADA
506-453-4568 (ph.), 506-453-4943 (fax.), jhc@omg.unb.ca
Mike Crutchlow and Bruce MacGowan
CHS -Central and Arctic and Atlantic
October 2002
Since 1996, the Canadian Hydrographic Service has been slowly
replacing
inshore single-beam hydrographic survey launches with launches equipped
with multibeam echo sounders. At this time (November 2002) there are 5
Simrad EM3000S
multibeam sonar
deployed across the country (Atlantic 1, Quebec 1, Central and Arctic 2
and Pacific 1). These are deployed on a range of platforms. Originally
all systems were installed on 31ft P-class vessels. At this time, only
two remain in this configuration. The other three have been moved
to larger 40ft and smaller ~24 ft platforms. In all cases, these
systems are primarily used for work in depths less
than 50m.
Initially it was felt that these multibeam systems would completely
replace
single beam hydrography for most applications. It quickly became
apparent
however, that, whilst they could provide near 100% coverage for the
first time,
the cost effectiveness was limited whenever depths were much less than
15m. For the systems in use by the CHS (Simrad EM3000S's), it is
operationally impractical to acquire multibeam data with
sectors greater than ~ +/- 60 degrees for three reasons:
As a result, swath widths of ~ 3.5 x water depth are seen here as
the
absolute maximum realistically possible. This is exasperated by the
CHS's conservative habit of routinely acquiring ~ 200% coverage (to
guarantee sounding density) with a
resulting line spacing of only 1.75x the sonar altitude (depth -draft).
As
a result in depths less than 20m, line spacing is always less than 35m
(7m in 5m of water! (1m draft)). Older CHS standing orders allowed
single beam
line spacing to be controlled by chart scale with typically no tighter
than ~ 50m spacing required for most coastal environments (without
sidescan coverage as it is not used by CHS).
Furthermore, the required MB line spacing is significantly
smaller than the typical half swath width of a conventional sidescan
sonar (most agencies that use sidescans operate at between 75 or 150m
per side with 200% coverage).Thus under these shallow water
conditions it is actually taking more line miles to achieve the
coverage requirement. Arguably the multibeam can be acquired at higher
speeds (although focussed sidescans are changing that).
Thus to date, extreme shallow water survey is taking longer using
the requirement of 100% multibeam coverage over the old single beam
model. Thus the CHS has been considering the use of sidescan
instrumentation. But a number of concerns exist:
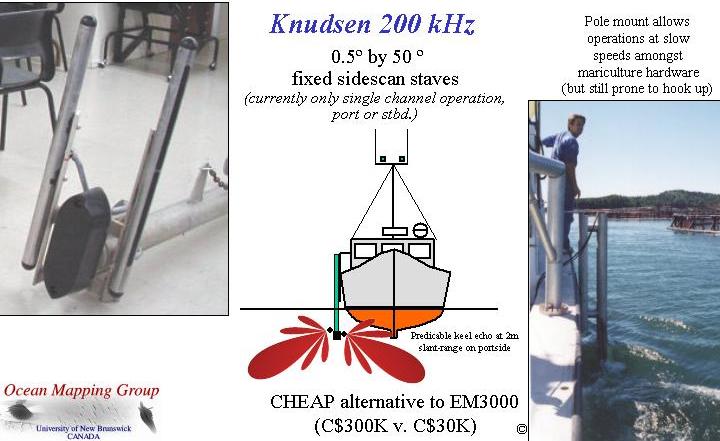
The Ocean Mapping Group (OMG) took delivery of one of the first 200 kHz sidescan staves offered by KEL in September 1999. At that time, with only a single stave and a single available channel (one of a 200/28kHz 320BP unit owned by the OMG), options were limited.
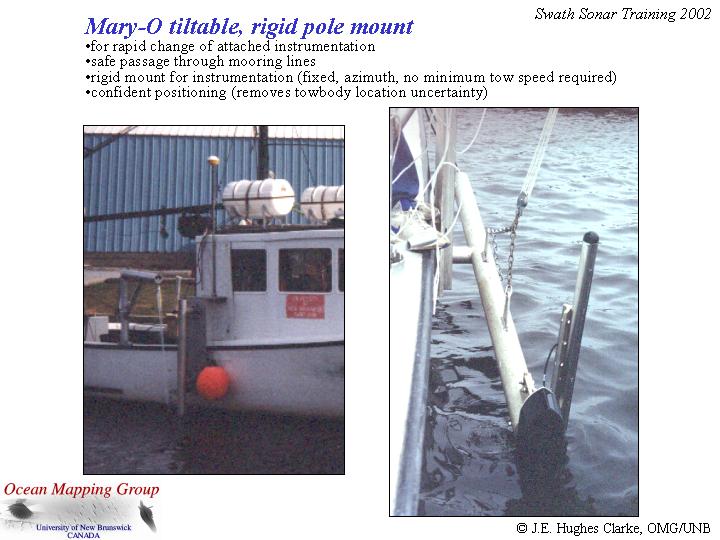
The single sidescan stave was originally mounted on a swinging pole
on the side of the vessel RV Mary-O (figure to left). Using a
switch box, the 200 kHz chanel could be transfered from the downward
looking 200k Hz beam (6 degree) to the sideward looking 200kHz sidescan
stave. The operator had to note when the switch happened as no digital
record of which transducer was used, was retained.
At this time, the 320 software was designed solely for conventional
vertical incidence echo sounding and the binary trace data was designed
purely for replay on a grey scale recorder. 1600 samples of linear
received
intensity were logged at only 8 bit resolution (even though the
internal digitisers actually generate data at 14 bit dynamic
range). A 40 logR TVG was
already available which was much more suited to incoherent rather than
coherent reflections.
However, because of the strongly +vely biased distribution of
scatterers
(bright coherent reflections ("glints") being 20-30 dB above typical
scattering
levels), in order not to saturate the data in the mid range where the
beam
boresite touched down, the data in the far range quickly dropped down
in
to the lowest DN values (0,1,2 etc..). As a result, data beyond
50m
slant range could not usefully be gained up in post-processing to
retain
any useful signature (unless the data in the mid-range saturated the
digitisers). Thus the limited dynamic range effectively controlled
the maximum usable swath width.
In part to alleviate the dynamic range and strong +ve bias of the
intensity data, the 8bit data were
logarithmically
compressed to better illustrate the available data content.
Imaging Geometry Considerations
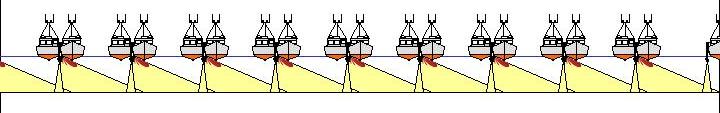
Based on the 50m maximum achievable swath, the usable line spacing
was
defined. The other critical factor was that with a single stave we
could
only image in one direction (starboard in this case). As a result, if a
line spacing of 40m was used, alternate line directions meant that
alternate
survey corridors were either 200% covered or not covered at all.
In order to get a complete image, line spacing of as little at 20m was
required.
Nevetheless, in waterdepths less than 10m this still provided a wider
effective swath that the EM3000S as operated to CHS standards
(200%coverage).
Hydrocamp 2000 results -the Kennebecasis Estuary
The first operational deployment of this system was part of the SE4083 undergraduate field camp in May 2000. As noted above, a 20m line spacing was used with alternate lines shot using the 200 kHz sidescan at 50m slant range. The in-between lines were run using the downward looking 200 kHz transducer to image the strong halocline present in the estuary. More details are available at http://www.omg.unb.ca/GGE/Kennebecasis_Project.html
Grand Bay Sill Survey - June 2000
In June of the same year a continuation of the Kennebecasis survey
was
extended to the west into Grand Bay using exactly the same imaging
geometry.
In this case the shallower sill (5-10m) was imaged over which it was
too
costly to survey with the EM3000S.. In these depths, the rate of survey
was significantly higher than that achieved (and abandoned) when using
a single headed EM3000. More details can be seen at : http://www.omg.unb.ca/GGE/Sill_Survey.html.
For the 2001 season, whislt the data remained 8 bit, at the request of the OMG, the original 14 bit intensity values were square rooted before being reduced to 8bit to reduce the range of values and thus better preserve the data within the available dynamic range. This single change allowed us now to log data out to 100m slant range without saturating the data in the main beam pattern boresite (at 30 deg off horizontal) whilst still having sufficient dynamic range for the weaker signal in the far range.
Imaging Geometry Considerations
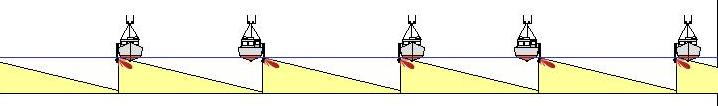
For 2001, whilst we still only had one 200 kHz channel available, we had purchased a second 200 kHz sidescan stave and a switch box.
As a result we were able to make more efficient use of shiptime by
alternately transmitting to port and starboard so that neighbouring
lines
complimented each other, rather than overlapped. We had to pick a
single
illumination direction, but this stilll allowed us to effectively
increase
our rate of coverage to a total of 4 x the Y2000 operations (2x for
slant
range, 2x for switching sides).
Whislt 100m range was achievable, it was found that the extremely
low
grazing angle data was routinely compromised by imaging tidal fronts
and other oceanographic phenomena (surface waves, thermoclines etc..)
thus the use of 100m slant range was not ideal for reliable target
detection.
Hydrocamp 2001 - The Musquash Estuary Survey
Our first operational deployment in 2001 was for the DFO sponsored
survey
of the Musquash Marine Protected Area.
see : http://gge.unb.ca/Research/OceanGov/musquash/hydro/SS/knudsen.html
for more details ....
July 2001 Limekin Bay Aquaculture site survey.
Later in 2001 we decided to try out the potential of these pole
mounted
sidescans for investigations of organic enrichment (primarily faecal
material
and excess food) under aquaculture site (salmon) cages. this was a
follow
on of the Letang Estuary EM3000 survey conducted in November 2000 by
CSL
Plover for Dave Wildish of SABS (which we processed).
Hughes Clarke, J.E., 2001,
Remote
Acoustic Characterisation of Mariculture Site Sediments: in Hargrave
and Phillips Eds., Environmental Studies for Sustainable Aquaculture
(ESSA), Canadian Technical Report of
Fisheries and Aquatic Sciences No.
2352.
We were hopeful that the 200 kHz imagery would provide
an adequate
substitute for the EM3000 data. The data were collected after the
cage sites had been moved and they were only occupied by juvenile fish
at the time of the survey. The inital results of the survey were
extremely
promising. Results were presented at the January 2002 ESSA meeting
at BIO and at the CHC 2002 meeting in Toronto.
Hughes Clarke,
J.E., Wildish, D. and
Akagi, H., 2002, Monitoring near-field changes at mariculture sites: a
comparison between multibeam and pole-mounted sidescan: in Hargrave,
B.T (Editor). 2002. Environmental Studies for Sustainable Aquaculture
(ESSA): 2002 Workshop Report. Can
Tech. Rep. Fish. Aquat. Sci. 2411: v+
112 pp.
Hughes Clarke, J.E., Wildish, D. and
Duxfield, A., 2002, Acoustic
Imaging of Salmonid Mariculture Sites: Canadian Hydrographic
Conference Proceedings
CDROM.
For 2002 an additional upgrade was now available allowing us for the first time to log 16 bit data (actually only 14 bits is used, but still a huge dynamic range advantage over the prior 8 bit data). As first implemented in May, the 16 bit data was available only on linear intensity data (the square-root compression was not implemented again until September of the year). Despite this, with the increased dynamic range, both the high intensites in the main beam pattern and the much reduce data outboard were all within the newly expanded dynamic range (and thus both could be compensated for using either empirical or predictive beam pattern models) and thus the detail retained is far improved.
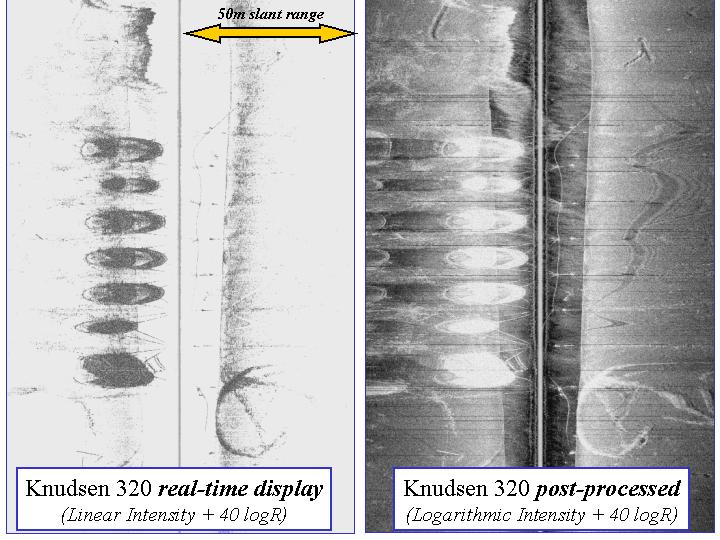
Unfortunately, the real time displays showed only linear
intensity
and so the operator could not usefully use the displays for real-time
target
detection. However, with logarithmic compression in post-processing the
data was seen to have all the available signal:
In September of 2002, the square-root compression was again reintroduced allowing even greater effective dynamic range as well as improved real time imaging.
As will also be shown below , by the fall of 2002, swept frequency
chirp
pulses became available at 200 kHz allowing vastly improved signal to
noise
conditions.
Imaging Geometry Considerations
In 2002 we were loaned an extra 320M first by Pacific Region CHS and
then subsequently KEL. This allowed us now to have two dedicated 200
kHz
channels (the second 320 now has one 28 kHz channel and one 3.5 kHz
channel).
We could thus for the first time, image both sides simultaneously as
would
a regular sidescan.
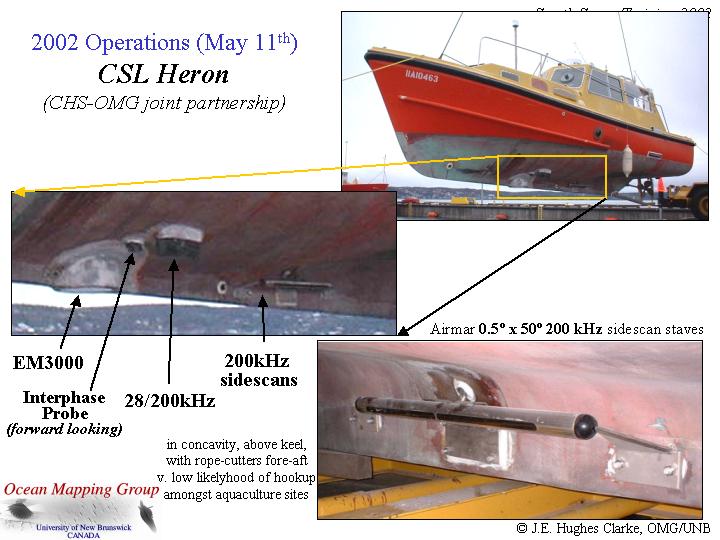
Additionally in April 2002 we took delivery of CSL Heron,
an ex.
CHS H-Class hydrographic Survey lanuch. We have now mounted the two
sidescan
staves permanently in the concave section on either side of the keel
(Fig. to left).
Hydrocamp 2002 - St. Andrews Harbour Survey
In May the first deployment of the Heron keel-mounted sidescan was
undertaken.
The floor of inner St. Andrews harbour was imaged using 40m line
spacing
and 50m slant range. The line spacing was chosen on the basis of the
desired
3.5 kHz sub-bottom profiilng line spacing. As a result of the 200%
overlap
two images were available imaging both to the east and the west (see
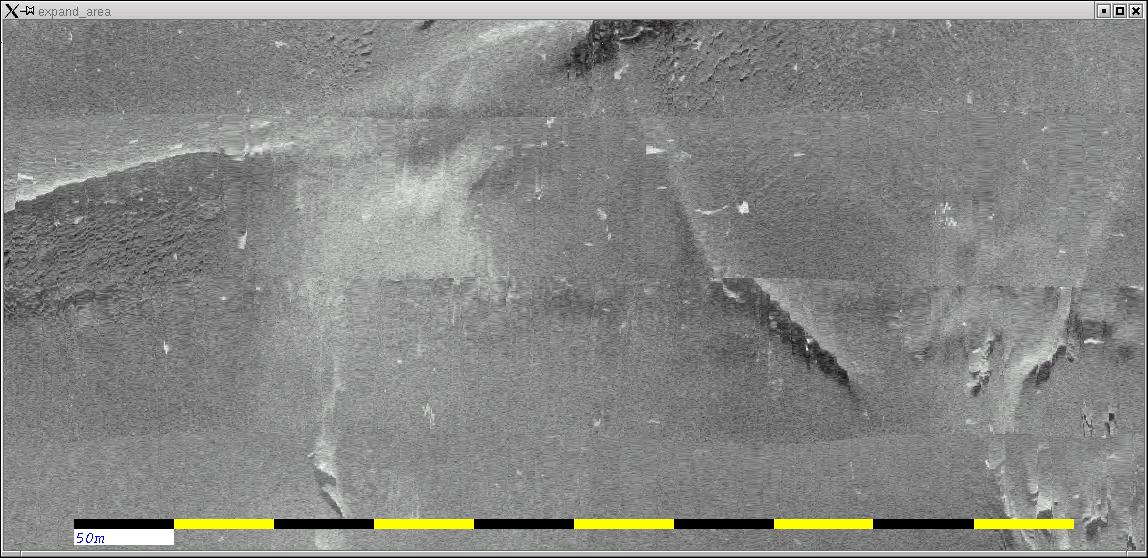
figure below).
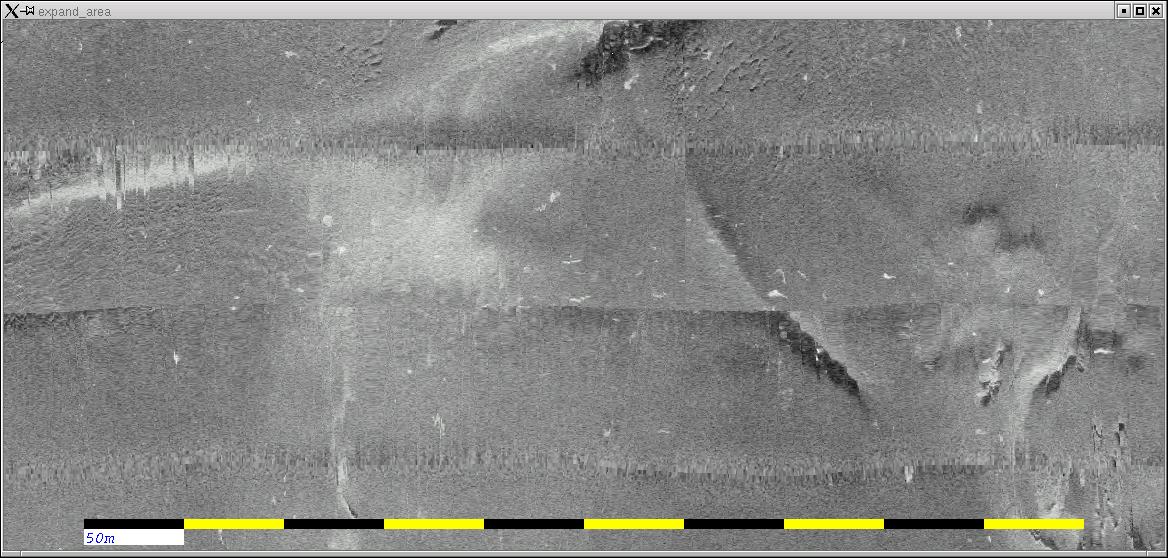
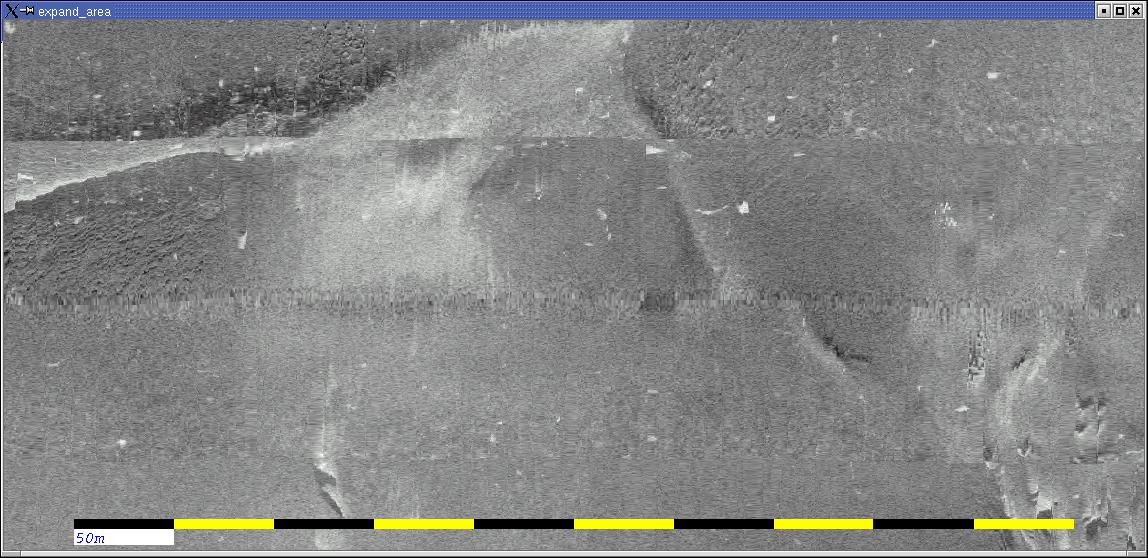
 This image uses a 40m line spacing
(dictated by the required 3.5 kHz subbottom profile line density), and
thus has the luxury of using either east-looking or west-looking
imagery only. The major problem visible in this image is the fact that
there was significant electrical interference in the data (source not
understood, not the 200 kHz interphase sounder though). The
second problem noted was that the bubble wake from the propellor on the
previous survey line was routinely imaged by the side looking back over
to the previous line (thus the image looking away from the last line
always proved superior in quality).
This image uses a 40m line spacing
(dictated by the required 3.5 kHz subbottom profile line density), and
thus has the luxury of using either east-looking or west-looking
imagery only. The major problem visible in this image is the fact that
there was significant electrical interference in the data (source not
understood, not the 200 kHz interphase sounder though). The
second problem noted was that the bubble wake from the propellor on the
previous survey line was routinely imaged by the side looking back over
to the previous line (thus the image looking away from the last line
always proved superior in quality).
The preliminary Hydrocamp 2002 data is available at
the web
site at which you can compare this image with the EM3000
bathymetry and backscatter data from the same area (not collected
simultaneously, rather collected on different tides and requiring much
higher line density).
May 2002 - Limekiln Bay Aquaculture Site Survey.
In May of 2002, the KEL sidescans were again deployed in Limekiln Bay (this time simultaneously with EM3000 data on the Heron). The hope was to add an extra time sequence to the study of the site. Whilst the K320 200 kHz sidescan data was very useful, at this time we noted two limiting factors.
Standard Shallow Water Multibeam Operations
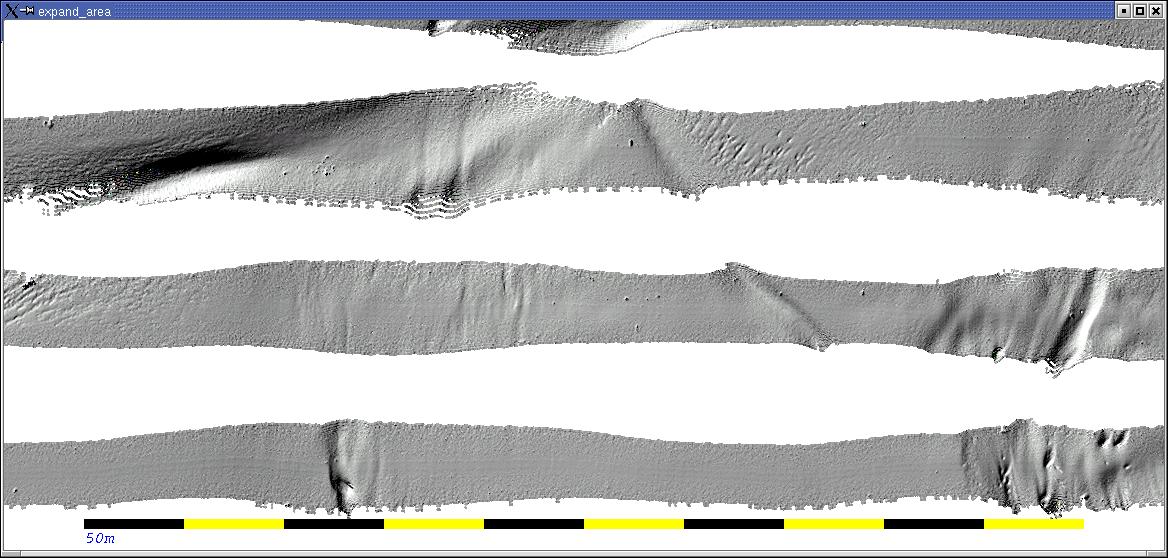
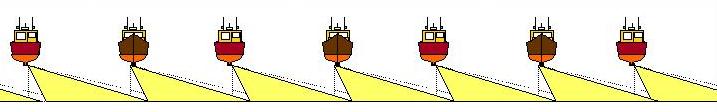
In this case we examine the results from using a 130 deg sector (4xWD) multibeam at 80m line spacing in depths ranging from 5 to 15m. As expected the swath widths (16-55m, remember 1m draft!) do not provide full seafloor coverage. Standard CHS operations run 200% coverage and thus we are well undersampling the seafloor.
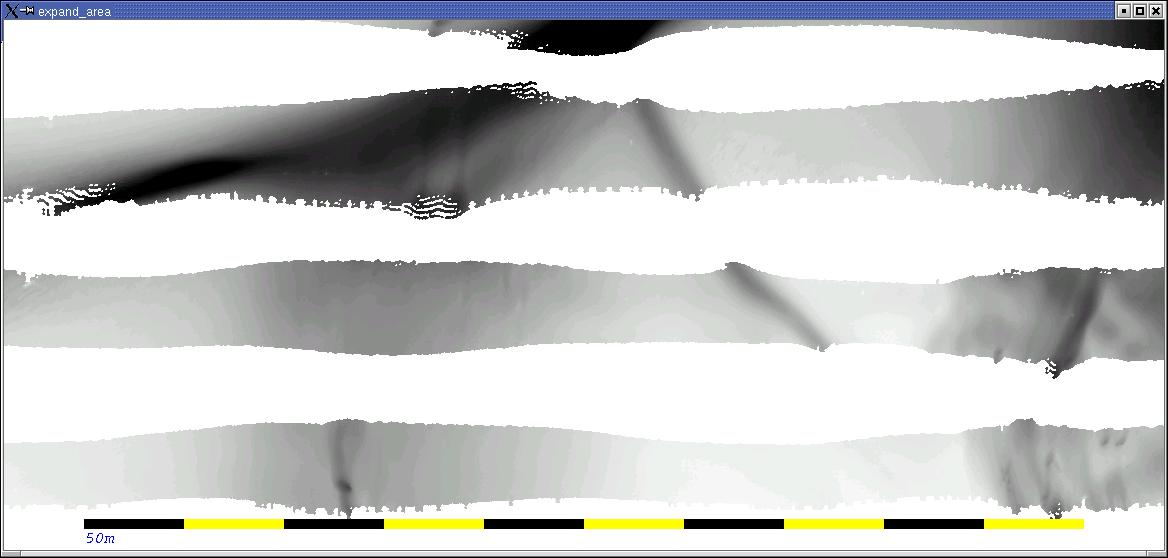 |
<< depth encoded (5-15m) sun-illuminated >> |
 |
 |
<< beam average full trace >> |
 |
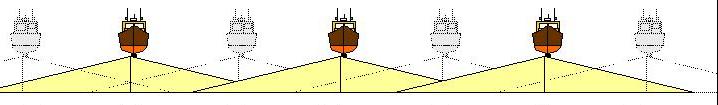
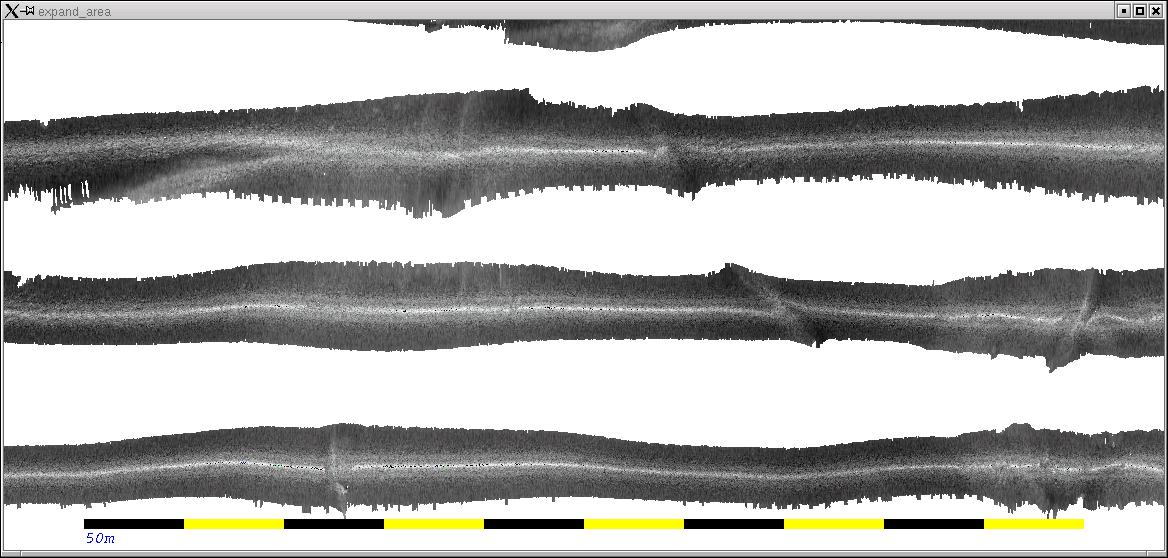
just using lines into out of the page...
just using lines into the page...
 |
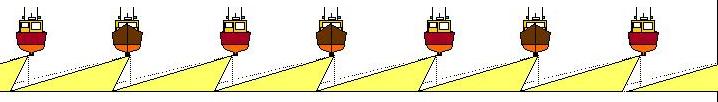
<< every second line, both sides every other second line, both sides >> both 160m line spacing 100m slant range per side. |
 |
With such a luxury of overlap, one can take the opportunity to optimise the visible sidescan image quality. Two major limitations exists with the prior pair of images:
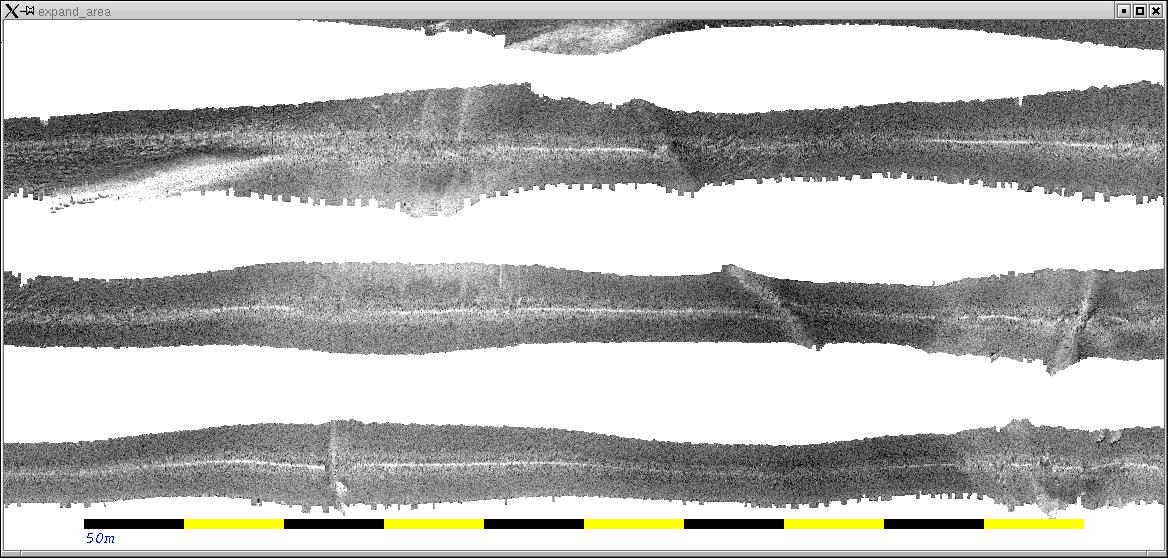
With the overlap one can now generate two images that get around
both these problems. For the first, one can replace the near nadir data
with data from the far range of the overlapping image. For the second
problem, with 200% coverage one can select to view data all on a common
azimuth.
Note that in both cases, for these approaches to work, one must be
extremely
confident of the image location. For a towfish deployed system this was
rarely the case (how many operators routinely use USBL positioning for
towbody
location in shallow water, and of those how many have a high quality
gyrocompass
in the towfish?).
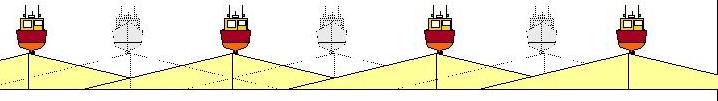
imaging to the west, far range overlapping nadir
imaging to the left, far range overlapping nadir
 |
<< just north looking just south looking >> both 80m line spacing, 100m slant range |
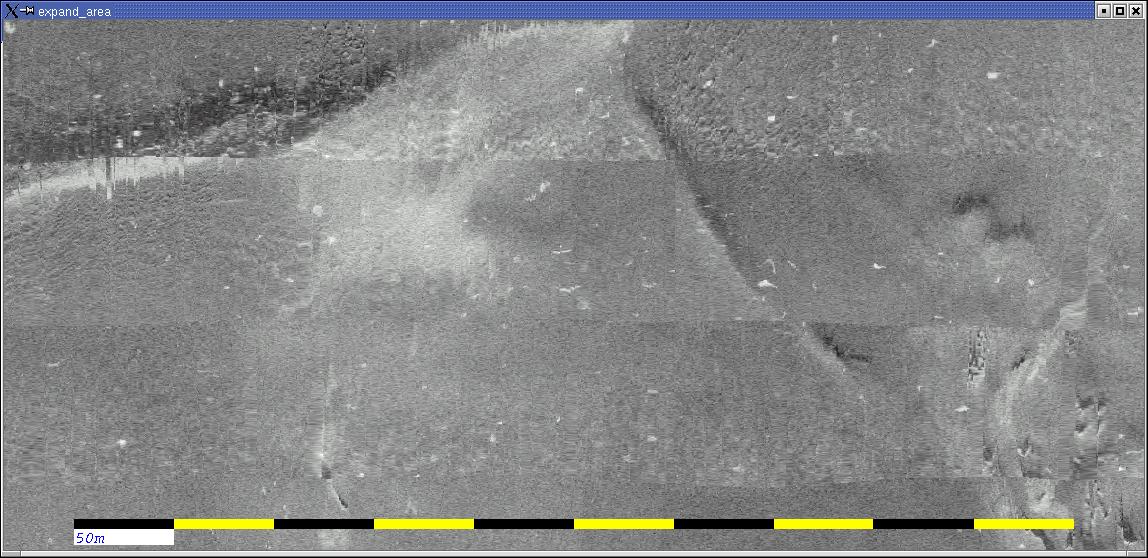 |
Three limitations can be seen:
 |
As part of the CHS testing we wanted to see what benefits there were to chirping the 200 kHz pulse. The standard shortest pulse length available is 0.1ms (~10kHz bandwidth). We chose to try the longest available chirped pulse of 3.2ms with a nominal 8kHz sweep). If the matched filtering worked properly we should see about the same range resolution while having a 30 fold increase in signal to noise. I think the images to the left speak for themselves.
|
October 2002 - 3rd Limekiln Bay Aquaculture site surveys.
These data were collected on the 10th October to look for changes in
the distribuiton of the seabed organic matter. No difference in the
imaging geometry existed at this time. Results can be seen at: results
of acquaculture imaging. And a paper on the quantification of the
change is available as:
Wildish, D.J., 2004,
Acoustic detection of organic enrichment in
sediments at a salmon farm is confirmed by independent groundtruthing
methods: Marine Ecology Progress
Series, v.267, p.99-105
A more general discussion on the relative advantages and disadvantages of multibeam v. sidescan imaging of salmon acquaculture sites can be found at:
Hughes Clarke, J.E., Wildish, D.
and
Duxfield, A., 2002, Acoustic
Imaging of Salmonid Mariculture Sites: Canadian Hydrographic
Conference Proceedings
CDROM.
Current status of KEL 200 kHz Sidescan System.
As of October 10th 2002.....
With improved real time displays (vertically scrolling, port and
starboard
reversed and with linear echo amplitude (sqrt(intensity)) the tools may
now operationally be used by the CHS. 4 pairs of sidescan staves
have been purchased by the CHS for use in all regions. Significant
software
development has been added to smoothly integrate with Hypack,
(the
CHS current line running and logging software). As the output data
is now available in 16bit XTF format, any standard sidescan mosacing
package
could be used. As the CHS using HIPS/SIPS in all regions, SIPS is
the most likely software postprocessing tool to be used.
Heading integration
The 320 Echo-control software still does not directly log heading input
into the XTF or KEB format
files (remains true as of 08/2004!). At this time the heading is logged
into the Hypack data stream
which
is time synchronised to the KEL clock. Thus the heading may be
extracted
from the Hypack files in post processing. This will meet the immediate
needs of of the CHS but leaves other users who choose not to use
the Hypack integration on their own.
Time synchronisation
Another remaining limitation is the stability of the clocks inside the
320. They can be synchronised to the PC controller clocks (which in
turn can be synchronised to GPS time). But from analysis of common fix
times recorded by the 320 and directly from a GPS receiver, it is clear
that the internal clocks drift several seconds in a day (and not just
linearly in one direction). This has created problems for newer
research ((2003-2004) where we have integrated roll pitch, heading and
heave, logged asynchronously through a simultaneously operating EM3000
multibeam system. Synchronisation issues are described in:
Hughes Clarke, J.E., 2004, Seafloor Characterization Using Keel-Mounted Sidescan: Proper Compensation for Radiometric and Geometric Distortion proceedings of the Canadian Hydrographic Conference 2004, Ottawa, CDROM.
Real time bottom tracking and slant range correction
Yet to be implemented in KEL Echo-Control...
At this time, the OMG software does the bottom tracking in
post-processing. This can be a problem in high water-column noise areas
though. As we usually log EM3000 multibeam at the same time, we often
substitute the minimum slant range achieved by that system instead.
This obviously is not available to most users however. An independent
(and preferably not interfering) single beam echo sounder is a possible
alternative, although the same problems exist concerning time
synchronisation.
Adaptive real-time TVG's..
Yet to be implemented in KEL Echo -Control...
Without a real time bottom track, no bottom-locked custom TVG's to account for beam pattern affects can be applied. Within the OMG software, once the bottom track is established, ensonified area , beam pattern and grazing angle dependence is quantitatively removed (described in paper quoted above).